

Mathematics, 28.08.2019 06:00, squadfam2024
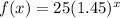
The number of members f(x) in a baseball club increased by 45% every year over a period of x years. the function below shows the relationship between f(x) and x:
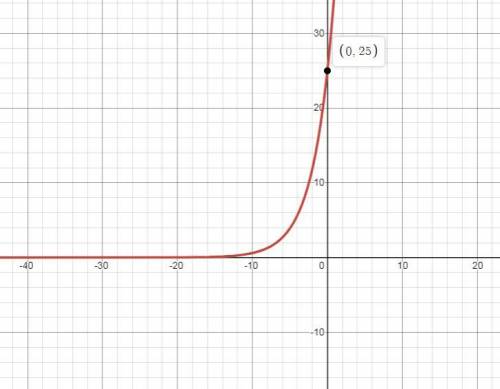
f(x) = 25(1.45)x
which of the following graphs best represents the function?
graph of f of x equals 1.45 multiplied by 25 to the power of x
graph of exponential function going up from left to right in quadrant 1 through the point 0, 0 and continuing towards infinity
graph of f of x equals 1.45 to the power of x
graph of f of x equals 25 multiplied by 1.45 to the power of x

Answers: 2


Similar questions
Mathematics, 23.06.2019 19:30, sam9350
Answers: 1
Mathematics, 29.07.2019 12:00, liamgreene90
Answers: 1
Do you know the correct answer?
The number of members f(x) in a baseball club increased by 45% every year over a period of x years....
Questions in other subjects:

English, 26.02.2020 21:52
Mathematics, 26.02.2020 21:52


