

Mathematics, 24.06.2019 21:30, rubal6
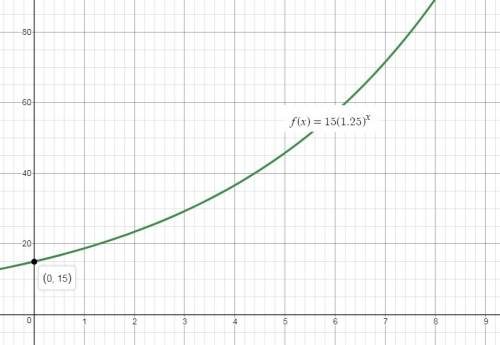
The number of members f(x) in joe's health club increased by 25% every year over a period of x years. the function below shows the relationship between f(x) and x: f(x) = 15(1.25)x which of the following graphs best represents the function?

Answers: 1


Other questions on the subject: Mathematics
Mathematics, 21.06.2019 19:30, ashtonsilvers2003
Evaluate the expression for the given value of the variable. ∣-4b-8∣+∣-1-b^2 ∣+2b^3 ; b=-2
Answers: 2
Mathematics, 21.06.2019 20:30, alexialiles19
Max recorded the heights of 500 male humans. he found that the heights were normally distributed around a mean of 177 centimeters. which statements about max’s data must be true? a) the median of max’s data is 250 b) more than half of the data points max recorded were 177 centimeters. c) a data point chosen at random is as likely to be above the mean as it is to be below the mean. d) every height within three standard deviations of the mean is equally likely to be chosen if a data point is selected at random.
Answers: 2
Mathematics, 21.06.2019 22:30, murdocksfamilyouoxvm
Adeposit of 5500 at 6% for 3 years equals
Answers: 2
Do you know the correct answer?
The number of members f(x) in joe's health club increased by 25% every year over a period of x years...
Questions in other subjects:

History, 08.10.2021 04:20

Chemistry, 08.10.2021 04:20

Physics, 08.10.2021 04:20

Social Studies, 08.10.2021 04:20

Physics, 08.10.2021 04:20
Mathematics, 08.10.2021 04:20


