

Mathematics, 24.07.2019 00:00, Govt9140
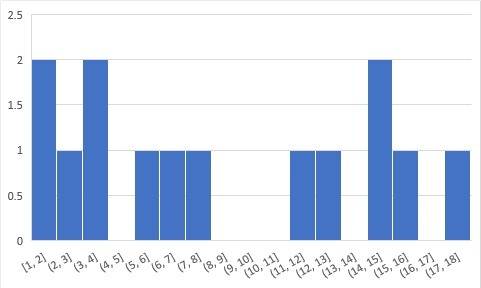
The data below show the number of games won by a football team in each of the last 15 seasons. what is a histogram that represents the data? 3 4 8 12 7 2 1 15 16 6 18 13 4 15

Answers: 2


Other questions on the subject: Mathematics
Mathematics, 21.06.2019 14:00, kassidyopry15
The table shows the distance traveled over time while traveling at a constant speed.
Answers: 1
Mathematics, 21.06.2019 16:40, ayoismeisalex
What are the solutions to the equation 4x2+3x=24-x
Answers: 2
Do you know the correct answer?
The data below show the number of games won by a football team in each of the last 15 seasons. what...
Questions in other subjects:


