

Mathematics, 04.11.2019 05:31, jarrettashlyn
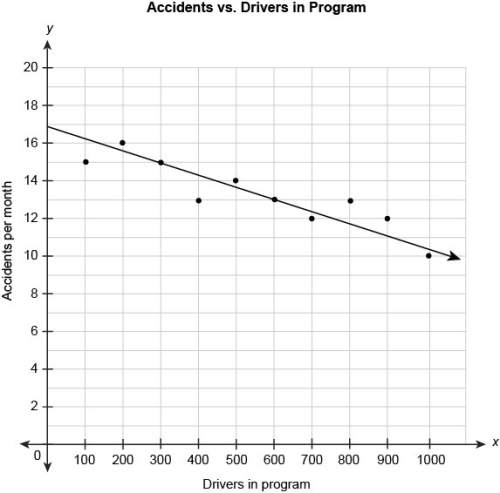
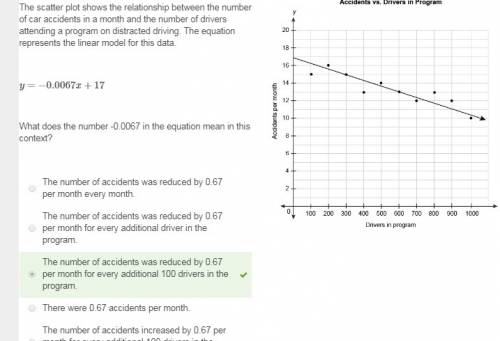
Me ! 1.) the scatter plot shows the relationship between the number of car accidents in a month and the number of drivers attending a program on distracted driving. the equation represents the linear model for this data. y=−0.0067x+17 what does the number -0.0067 in the equation mean in this context? a. the number of accidents increased by 0.67 per month for every additional 100 drivers in the program. b. there were 0.67 accidents per month. c. the number of accidents was reduced by 0.67 per month for every additional 100 drivers in the program. d. the number of accidents was reduced by 0.67 per month every month. e. the number of accidents was reduced by 0.67 per month for every additional driver in the program.

Answers: 3


Other questions on the subject: Mathematics
Mathematics, 21.06.2019 23:30, pennygillbert
The area (a) of a circle with a radius of r is given by the formula and its diameter (d) is given by d=2r. arrange the equations in the correct sequence to rewrite the formula for diameter in terms of the area of the circle.
Answers: 1
Mathematics, 22.06.2019 02:30, katrinajernae8216
Find the difference in area between the circle and the triangle. click on the answer until the correct answer is showing. possible answers: a = 4 pi - 8a = 9 pi - 9/2 √3a = 16/3 pia = 16a = 27 pi
Answers: 1
Do you know the correct answer?
Me ! 1.) the scatter plot shows the relationship between the number of car accidents in a month and...
Questions in other subjects:


