

Mathematics, 19.12.2021 09:40, ayoismeisalex
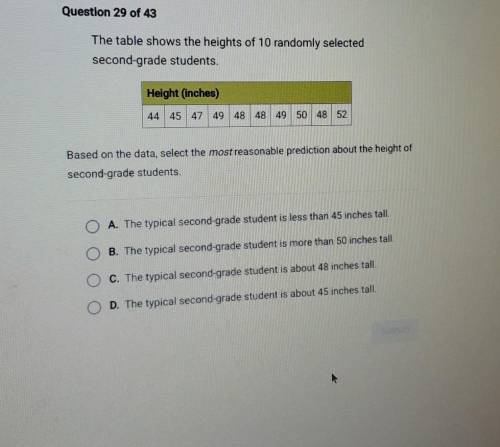
The table shows the heights of 10 randomly selected second-grade students. Height (inches) 44 | 45 | 47 | 49 | 48 | 48 | 49 | 50 | 48 52 Based on the data, select the most reasonable prediction about the height of second-grade students. A. The typical second-grade student is less than 45 inches tall. B. The typical second-grade student is more than 50 inches tall. C. The typical second-grade student is about 48 inches tall. 90 D. The typical second-grade student is about 45 inches tall. SUOT

Answers: 2


Other questions on the subject: Mathematics
Mathematics, 21.06.2019 20:00, emilysambrano2
Which part of a 2-column proof is the hypothesis of the conjecture? a) given b) reasons c) prove d) statements ! i think it's b but i'm not quite
Answers: 3
Mathematics, 22.06.2019 00:00, keving4three
240 seventh graders and two-thirds of the students participate in after-school activities how many students participate in after-school activities
Answers: 1
Mathematics, 22.06.2019 00:20, soystersoce
When steve woke up. his temperature was 102 degrees f. two hours later it was 3 degrees lower. what was his temperature then?
Answers: 1
Do you know the correct answer?
The table shows the heights of 10 randomly selected second-grade students. Height (inches) 44 | 45 |...
Questions in other subjects:


