

Mathematics, 07.12.2021 02:40, MrSnuffleBuns4277
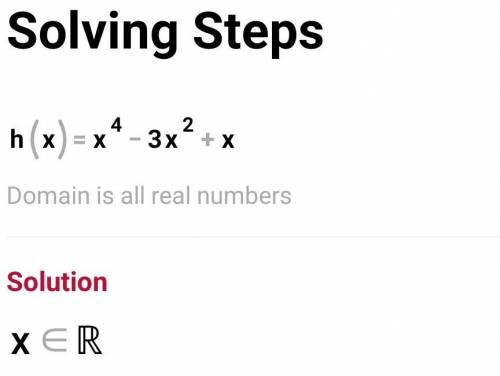
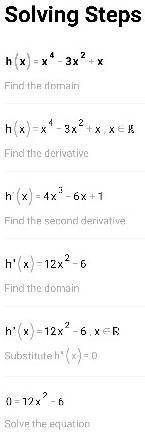
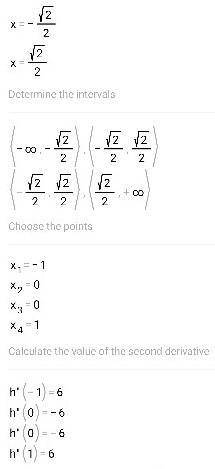
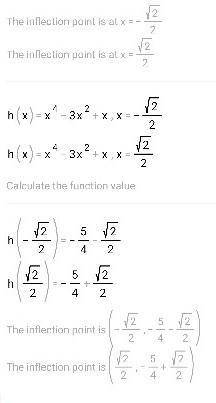
graph h(x)=x^4-3x^2+x. identity the x intercepts and the points where the local maximum and local minimum occur. determine the intervals for which the function is increasing or decreasing. Round to the nearest hundredth if necessary

Answers: 2


Other questions on the subject: Mathematics
Mathematics, 22.06.2019 05:00, cathydaves
Does 9q + 7 also equal 7 + 9q ? (simplifying algebraic expressions)
Answers: 1
Mathematics, 22.06.2019 07:00, porkhappycom
The graph of f(x) - 3.2% - 3 is shown below. g(x) is a transformation of f(x). how would you write the equation for the function g(x)? g ) = 3.2 .3
Answers: 2
Mathematics, 22.06.2019 07:30, bbyitskeke7160
Which sample fairly represents the population? check all that apply.
Answers: 1
Do you know the correct answer?
graph h(x)=x^4-3x^2+x. identity the x intercepts and the points where the local maximum and local mi...
Questions in other subjects:
Mathematics, 28.01.2020 21:04
Mathematics, 28.01.2020 21:04


Mathematics, 28.01.2020 21:04
Mathematics, 28.01.2020 21:04
Mathematics, 28.01.2020 21:04

Chemistry, 28.01.2020 21:04


