


3| 5 0 4

Mathematics, 11.06.2021 17:10, jenaycasmall
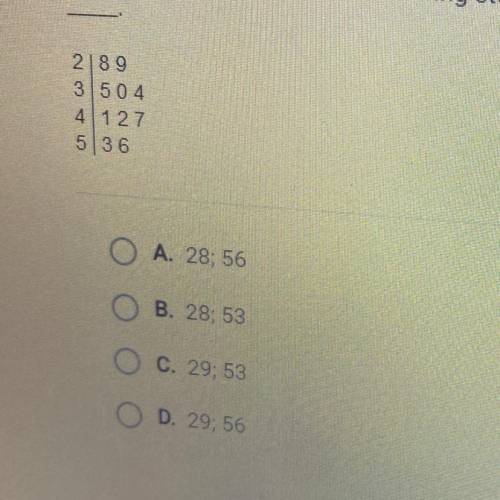
The data represented by the following stem-and-leaf plot range from _ to _.
2| 8 9
3| 5 0 4
4| 1 2 7
5| 3 6

Answers: 2
Other questions on the subject: Mathematics
Mathematics, 22.06.2019 00:00, lllamasarebae5995
I've been working on this for a few days and i just don't understand, it's due in a few hours. you. the direction of a vector is defined as the angle of the vector in relation to a horizontal line. as a standard, this angle is measured counterclockwise from the positive x-axis. the direction or angle of v in the diagram is α.part a: how can you use trigonometric ratios to calculate the direction α of a general vector v = < x, y> similar to the diagram? part bsuppose that vector v lies in quadrant ii, quadrant iii, or quadrant iv. how can you use trigonometric ratios to calculate the direction (i. e., angle) of the vector in each of these quadrants with respect to the positive x-axis? the angle between the vector and the positive x-axis will be greater than 90 degrees in each case. part cnow try a numerical problem. what is the direction of the vector w = < -1, 6 > ?
Answers: 1
Mathematics, 22.06.2019 02:30, caprisun6779
Abby is collecting rainfall data. she finds that one value of the data set is a high-value outlier. which statement must be true? abby will use a different formula for calculating the standard deviation. the outlier will increase the standard deviation of the data set. the spread of the graph of the data will not change. abby will not use the mean when calculating the standard deviation.
Answers: 3
Mathematics, 22.06.2019 04:00, lollipop83
Which equation represents the function on the graph?
Answers: 2
Do you know the correct answer?
The data represented by the following stem-and-leaf plot range from _ to _.
2| 8 9
3| 5 0 4
3| 5 0 4
Questions in other subjects:


