


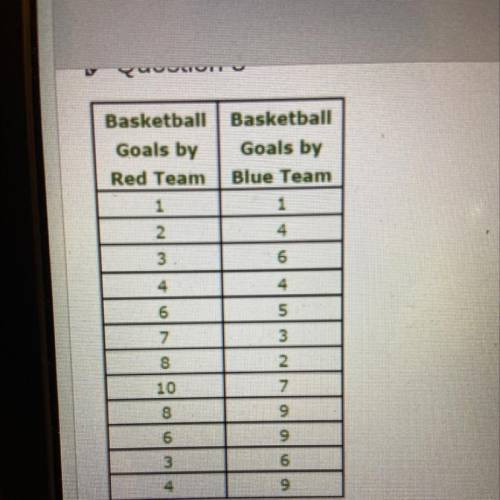
Which BEST describes the association between goals by the Red Team and the Blue Team?
A
nonli...

Mathematics, 21.05.2021 21:50, masonbartolo8184
Which BEST describes the association between goals by the Red Team and the Blue Team?
A
nonlinear association
B
positive association
С
no association
D
negative association

Answers: 3
Other questions on the subject: Mathematics
Mathematics, 21.06.2019 17:30, decoreyjpaipxv
Miguel’s teacher asks him to color 4/8 of his grid. he must use 3 colors: red, blue, and green. there must be more green sections than red sections. how can miguel color all the sections of his grid to follow all the rules
Answers: 1
Mathematics, 22.06.2019 00:30, trujillo03
1.3.25 question suppose 40​% of all voters voted for a particular candidate. to simulate exit polls regarding whether or not voters voted for this​ candidate, five random samples of size 1010 and five random samples of size 10001000 have been generated using technology using a population proportion of 0.400.40​, with the accompanying results. complete parts a through c below. click the icon to view the simulation results. a. observe how the sample proportions of successes vary around 0.400.40. simulation compared to sample prop simulation compared to sample prop 1 ▾ 6 ▾ greater than 0.40 less than 0.40 equal to 0.40 2 ▾ less than 0.40 greater than 0.40 equal to 0.40 7 ▾ greater than 0.40 less than 0.40 equal to 0.40 3 ▾ greater than 0.40 less than 0.40 equal to 0.40 8 ▾ equal to 0.40 greater than 0.40 less than 0.40 4 ▾ greater than 0.40 equal to 0.40 less than 0.40 9 ▾ less than 0.40 greater than 0.40 equal to 0.40 5 ▾ equal to 0.40 less than 0.40 greater than 0.40 10 ▾ equal to 0.40 greater than 0.40 less than 0.40 click to select your answer(s) and then click check answer. 2 parts remaining clear all check answer
Answers: 3
Mathematics, 22.06.2019 02:30, familyk0jj3
Graph the function =gx+2x3 and give its domain and range using interval notation.
Answers: 3
Do you know the correct answer?
Questions in other subjects:


