

Mathematics, 06.05.2021 23:40, drdeb7766
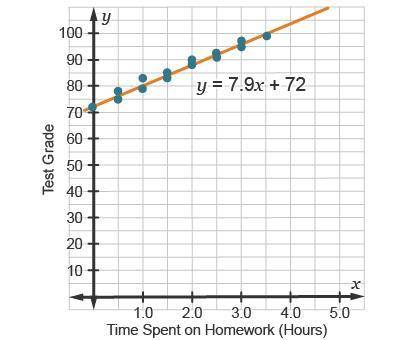
The data reflects the amount of time spent on homework (x), paired with a corresponding test grade (y).
How can the y-intercept of the line be interpreted?
The minimum time spent on homework is approximately 72 hours.
The average time spent on homework is approximately 7.9 hours.
If no time is spent on homework, the test grade is approximately 72.
If no time is spent on homework, the test grade is approximately 7.9.

Answers: 3


Other questions on the subject: Mathematics
Mathematics, 21.06.2019 17:00, trinityanne1738
Two streets intersect at a 30- degree angle. at the intersection, the are four crosswalks formed that are the same length. what type of quadrilateral is formed by the crosswalks?
Answers: 2
Do you know the correct answer?
The data reflects the amount of time spent on homework (x), paired with a corresponding test grade (...
Questions in other subjects:
Mathematics, 30.08.2019 19:40
Mathematics, 30.08.2019 19:40


Social Studies, 30.08.2019 19:40


Business, 30.08.2019 19:40


