


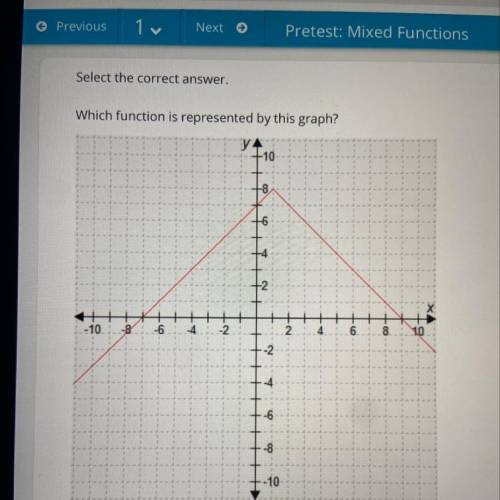
Which function is represented by this graph?
A. F(x) = - | x - 1 | + 8
B. F(x) = - | x - 8 |...

Mathematics, 03.05.2021 22:30, jada741
Which function is represented by this graph?
A. F(x) = - | x - 1 | + 8
B. F(x) = - | x - 8 | + 1
C. F(x) = - | x + 8 | -1
D. F(x) = - | x + 1 | - 8

Answers: 3
Other questions on the subject: Mathematics
Mathematics, 21.06.2019 23:10, jaylenmiller437
Astudent draws two parabolas on graph paper. both parabolas cross the x-axis at (–4, 0) and (6, 0). the y-intercept of the first parabola is (0, –12). the y-intercept of the second parabola is (0, –24). what is the positive difference between the a values for the two functions that describe the parabolas? write your answer as a decimal rounded to the nearest tenth
Answers: 2
Mathematics, 22.06.2019 02:00, bchagnard2122
Grant simplified the expression 1.5(-3.2 + 2.5) his work is shown below explain the error in grants work
Answers: 1
Mathematics, 22.06.2019 02:30, HolaConcheeDaBrycee
Six random samples were taken each year for three years. the table shows the inferred population for each type of fish for each year.
Answers: 1
Mathematics, 22.06.2019 04:00, probablyacommunist
2pointswhat is the best next step in the construction of the perpendicular bisector ofab?
Answers: 3
Do you know the correct answer?
Questions in other subjects:
Mathematics, 24.04.2020 08:55


Mathematics, 24.04.2020 08:55


