

Mathematics, 30.04.2021 21:40, Nathanr23
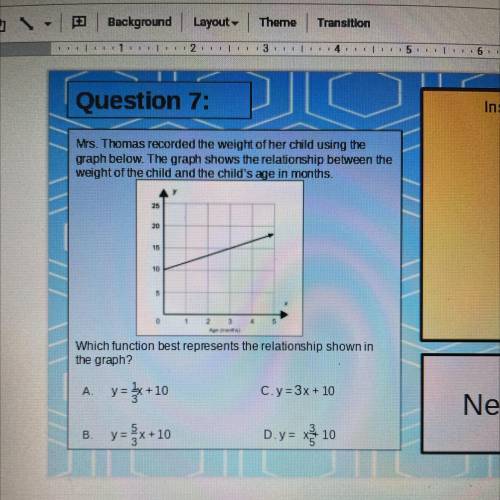
Mrs. Thomas recorded the weight of her child using the
graph below. The graph shows the relationship between the
weight of the child and the child's age in months.
25
20
15
10
5
1
2
3
Which function best represents the relationship shown in
the graph?
A. y= {x+10
C. y=3x + 10
B
y=-x+10
D. y= xỷ 10

Answers: 1


Other questions on the subject: Mathematics
Mathematics, 21.06.2019 15:00, voldermort9695
With these: 18/36 = 1/? missing number change 1 5/8 to improper fraction. change 19/5 to a mixed number.
Answers: 1
Mathematics, 21.06.2019 19:00, yehnerthannah
Through non-collinear points there is exactly one plane.
Answers: 1
Mathematics, 21.06.2019 19:00, niquermonroeee
Human body temperatures have a mean of 98.20° f and a standard deviation of 0.62°. sally's temperature can be described by z = 1.4. what is her temperature? round your answer to the nearest hundredth. 99.07°f 97.33°f 99.60°f 100.45°f
Answers: 1
Do you know the correct answer?
Mrs. Thomas recorded the weight of her child using the
graph below. The graph shows the relations...
Questions in other subjects:


History, 31.08.2021 01:00
Mathematics, 31.08.2021 01:00


