

Mathematics, 31.08.2021 01:00, anthonylopez1
ANSWER NOW PLEASE ASAP
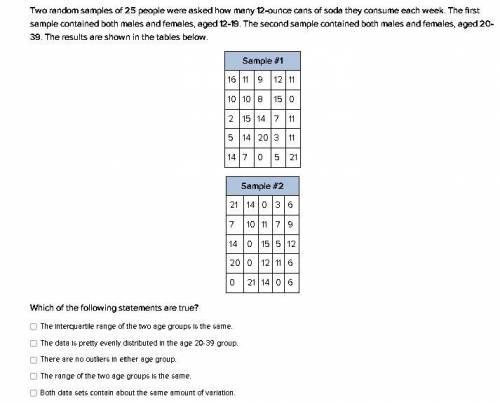
Two random samples of 25 people were asked how many 12-ounce cans of soda they consume each week. The first sample contained both males and females, aged 12-19. The second sample contained both males and females, aged 20-39. The results are shown in the tables below.
(LOOK AT THE IMAGE)
Which of the following statements are true?
The interquartile range of the two age groups is the same.
The data is pretty evenly distributed in the age 20-39 group.
There are no outliers in either age group.
The range of the two age groups is the same.
Both data sets contain about the same amount of variation.

Answers: 2


Other questions on the subject: Mathematics
Mathematics, 21.06.2019 14:30, cutielove2912
Fiona and her friends are playing a game by guessing where a coin will land when it is randomly dropped inside the square shown below. fiona guesses that the coin is likely to land in the blue area. which explains whether or not fiona is correct and why?
Answers: 1
Mathematics, 21.06.2019 18:00, tmrsavage02p7cj16
Ageologist had two rocks on a scale that weighed 4.6 kilograms together. rock a was 0.5 of the total weight. how much did rock a weigh?
Answers: 1
Mathematics, 21.06.2019 18:00, justijust500
Ijust need to see how to do this. so you don’t have to answer all of them just a step by step explanation of one.
Answers: 3
Do you know the correct answer?
ANSWER NOW PLEASE ASAP
Two random samples of 25 people were asked how many 12-ounce cans of soda t...
Questions in other subjects:

English, 03.07.2021 02:40


Computers and Technology, 03.07.2021 02:40


Computers and Technology, 03.07.2021 02:40


