

Mathematics, 30.04.2021 18:00, brandiwingard
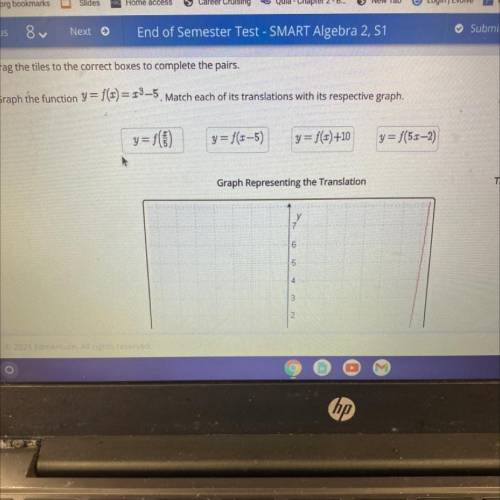
Drag the tiles to the correct boxes to complete the pairs.
Graph the function y = f(x) = 13–5. Match each of its translations with its respective graph.
y=f(1
y=f(x–5)
y= f() +10
y = f(50-2)
Graph Representing the Translation
Translation
6
5
4.
3
2
2021 Edmentum. All rights reserved

Answers: 1


Other questions on the subject: Mathematics
Mathematics, 22.06.2019 01:00, shetherealbrat
Jack is considering a list of features and fees for current bank: jack plans on using network atms about 4 times per month. what would be jack’s total estimated annual fees for a checking account with direct paycheck deposit, one overdraft per year, and no 2nd copies of statements? a. $44 b. $104 c. $144 d. $176
Answers: 1
Mathematics, 22.06.2019 02:00, mathhelppls14
1. the manager of collins import autos believes the number of cars sold in a day (q) depends on two factors: (1) the number of hours the dealership is open (h) and (2) the number of salespersons working that day (s). after collecting data for two months (53 days), the manager estimates the following log-linear model: q 4 equation 1 a. explain, how to transform the log-linear model into linear form that can be estimated using multiple regression analysis. the computer output for the multiple regression analysis is shown below: q4 table b. how do you interpret coefficients b and c? if the dealership increases the number of salespersons by 20%, what will be the percentage increase in daily sales? c. test the overall model for statistical significance at the 5% significance level. d. what percent of the total variation in daily auto sales is explained by this equation? what could you suggest to increase this percentage? e. test the intercept for statistical significance at the 5% level of significance. if h and s both equal 0, are sales expected to be 0? explain why or why not? f. test the estimated coefficient b for statistical significance. if the dealership decreases its hours of operation by 10%, what is the expected impact on daily sales?
Answers: 2
Do you know the correct answer?
Drag the tiles to the correct boxes to complete the pairs.
Graph the function y = f(x) = 13–5. Mat...
Questions in other subjects:

Mathematics, 24.06.2019 23:00

Computers and Technology, 24.06.2019 23:00

Mathematics, 24.06.2019 23:00


