

Mathematics, 14.04.2021 22:00, yani246
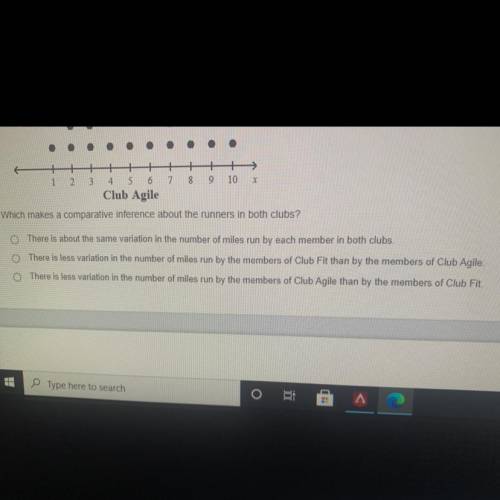
The dot plot shows a random sample of number of miles completed in a session by two different clubs. Compare the mean values of the dot plot. Round to the nearest tenth.

Answers: 1


Other questions on the subject: Mathematics
Mathematics, 22.06.2019 05:00, ayoismeisalex
Aubrey read 29 books and eli read 52 books what number equals to the number of books aubrey read
Answers: 1
Mathematics, 22.06.2019 07:00, nefertiri64
All below answer as a ratio in simplest form a. 8 feet to 6 yards as a ratio b. 76 centimeters to 1 meter c. 6 cups to 4 pints d. 9 gallons to 21 quarts e. 45 seconds to 2 hours f. 4 years to 8 months
Answers: 1
Do you know the correct answer?
The dot plot shows a random sample of number of miles completed in a session by two different clubs....
Questions in other subjects:


Social Studies, 04.04.2020 01:02


