

Mathematics, 23.03.2021 05:30, devo7420
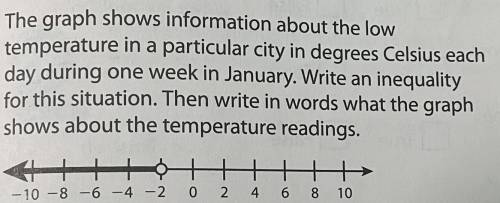
3 The graph shows information about the low
temperature in a particular city in degrees Celsius each
day during one week in January. Write an inequality
for this situation. Then write in words what the graph
shows about the temperature readings. (photo below)

Answers: 2


Other questions on the subject: Mathematics
Mathematics, 21.06.2019 14:10, mbatton879
5500 dollars is placed in an account with an annual interest rate of 6.5%. to the nearest tenth of a year, how long will it take for the account value to reach 19700 dollars?
Answers: 2
Mathematics, 21.06.2019 16:00, ctyrector
Asap for seven months an ice creams vendor collects data showing the number of cones sold a day (c) and the degrees above 70 degrees f the vendor finds that there is a positive linear association between c and t that is the best modeled by this equation c=3.7t+98 which statement is true? the model predicts that the average number of cones sold in a day is 3.7 the model predicts that the average number of cones sold i a day is 98 a model predicts that for each additional degree that the high temperature is above 70 degres f the total of number of cones sold increases by 3.7 the model predicts for each additional degree that the high temperature is above 70 degrees f the total number of cones sold increasingly by 98
Answers: 3
Do you know the correct answer?
3 The graph shows information about the low
temperature in a particular city in degrees Celsius eac...
Questions in other subjects:


History, 06.08.2019 03:10

English, 06.08.2019 03:10
English, 06.08.2019 03:10


