


The graph shows the value of an investment after x years
(The coordinates are)
0,500
1,...

Mathematics, 11.03.2021 23:40, destinybonmer
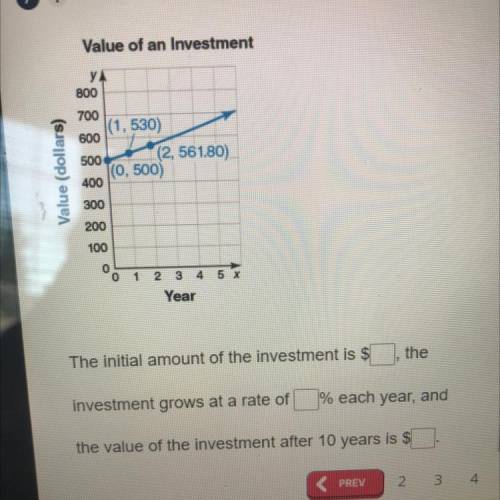
The graph shows the value of an investment after x years
(The coordinates are)
0,500
1,530
2,561.80
What is the initial amount
What rate does the initial amount grow at
And what is the value after 10 years?

Answers: 1
Other questions on the subject: Mathematics
Mathematics, 21.06.2019 16:00, anthonyjackson12aj
What are the measures of ∠a, ∠b, ∠c and ∠d? explain how to find each of the angle measure.
Answers: 1
Mathematics, 21.06.2019 20:10, paigeleahfarbeoy2ork
Which ratios are equivalent to 10: 16? check all that apply. 30 to 48 25: 35 8: 32 5 to 15
Answers: 1
Mathematics, 21.06.2019 22:00, sherman55
(05.03 mc) part a: explain why the x-coordinates of the points where the graphs of the equations y = 4x and y = 2x−2 intersect are the solutions of the equation 4x = 2x−2. (4 points) part b: make tables to find the solution to 4x = 2x−2. take the integer values of x between −3 and 3. (4 points) part c: how can you solve the equation 4x = 2x−2 graphically? (2 points)
Answers: 1
Do you know the correct answer?
Questions in other subjects:
Mathematics, 09.06.2021 03:00

Social Studies, 09.06.2021 03:00

English, 09.06.2021 03:00

History, 09.06.2021 03:00
Mathematics, 09.06.2021 03:00

Mathematics, 09.06.2021 03:00

Mathematics, 09.06.2021 03:00


