

Mathematics, 05.03.2021 01:00, AliceYT
10
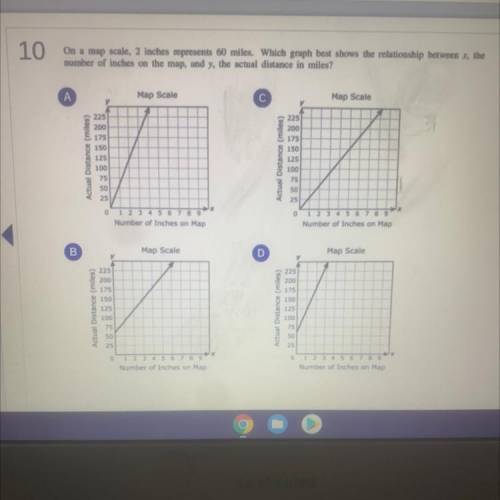
On a map scale, 2 inches represents 60 miles. Which graph best shows the relationship between x, the
number of inches on the map, and y, the actual distance in miles?
A
Map Scale
с
Map Scale
Actual Distance (miles)
225
200
175
150
125
100
75
Actual Distance (miles)
225
200
175
150
125
100
75
50
25
50
25
0 1 2 3 4 5 6 7 8 9
Number of Inches on Map
0 1 2 3 4 5 6 7 8 9
Number of Inches on Map
B
Map Scale
D
Map Scale
y
225
200
E 175
8 150
Actual Distance (miles)
125
Actual Distance (miles)
225
200
175
8 150
125
100
75
50
25
100
75
50
25
0
0
1 2 3 4 5 6 7 8 9
Number of Inches on Map
1 2 3 4 5 6 7 8 9
Number of Inches on Map

Answers: 1


Other questions on the subject: Mathematics
Mathematics, 21.06.2019 20:30, brookieharrisop5n7us
What is the volume of the cone to the nearest cubic millimeter? (use π = 3.14) a) 46 mm3 b) 128 mm3 c) 183 mm3 d) 275 mm3 diameter = 5 mm height = 7 mm how do you do this problem step by step?
Answers: 1
Mathematics, 21.06.2019 22:30, qveensentha59
Which of the functions below could have created this graph?
Answers: 1
Do you know the correct answer?
10
On a map scale, 2 inches represents 60 miles. Which graph best shows the relationship between x,...
Questions in other subjects:

Mathematics, 02.07.2019 11:20
Mathematics, 02.07.2019 11:20
Mathematics, 02.07.2019 11:20
Mathematics, 02.07.2019 11:20


