
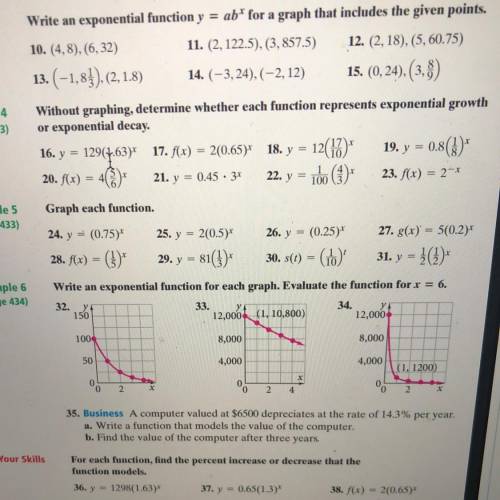
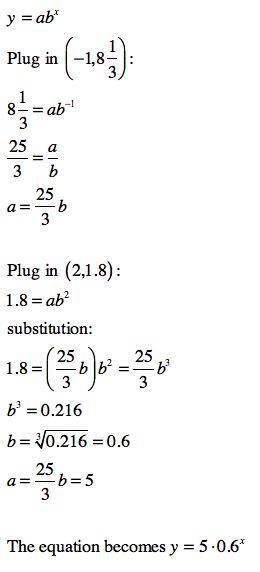


I need help with number 13.. no idea how to solve it.
...

Answers: 1
Other questions on the subject: Mathematics

Mathematics, 21.06.2019 17:30, bradleycawley02
Lems1. the following data set represents the scores on intelligence quotient(iq) examinations of 40 sixth-grade students at a particular school: 114, 122, 103, 118, 99, 105, 134, 125, 117, 106, 109, 104, 111, 127,133, 111, 117, 103, 120, 98, 100, 130, 141, 119, 128, 106, 109, 115,113, 121, 100, 130, 125, 117, 119, 113, 104, 108, 110, 102(a) present this data set in a frequency histogram.(b) which class interval contains the greatest number of data values? (c) is there a roughly equal number of data in each class interval? (d) does the histogram appear to be approximately symmetric? if so, about which interval is it approximately symmetric?
Answers: 3
Mathematics, 21.06.2019 21:30, kingdrew27
Due to a packaging error, 4 cans labeled diet soda were accidentally filled with regular soda and placed in a 12 pack carton of diet soda. two cans were randomly selected from this 12 pack. what is the probability that both cans were regular soda?
Answers: 2
Mathematics, 21.06.2019 22:00, jnkbragg3696
Problem situation: caren is making rice and beans. she can spend no more than $10 on ingredients. she buys one bag of rice for $4.99. beans cost $0.74 per pound. how many pounds of beans, x, can she buy? inequality that represents this situation: 10≥4.99+0.74x drag each number to show if it is a solution to both the inequality and the problem situation, to the inequality only, or if it is not a solution.
Answers: 1
Do you know the correct answer?
Questions in other subjects:

Health, 07.03.2021 14:00
Mathematics, 07.03.2021 14:00

Chemistry, 07.03.2021 14:00

Health, 07.03.2021 14:00
Mathematics, 07.03.2021 14:00

Social Studies, 07.03.2021 14:00


