


Can someone do it quickly since it’s a timed test
Paper 2
The scatter diagram shows the score...

Mathematics, 12.02.2021 14:10, spycn5069
Can someone do it quickly since it’s a timed test
Paper 2
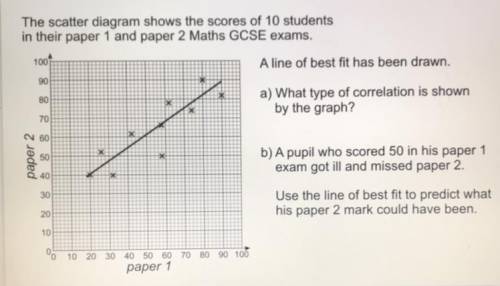
The scatter diagram shows the scores of 10 students
in their paper 1 and paper 2 Maths GCSE exams.
1001
A line of best fit has been drawn.
90
a) What type of correlation is shown
by the graph?
80
A
70
60
paper 2
50
40
b) A pupil who scored 50 in his paper 1
exam got ill and missed paper 2.
Use the line of best fit to predict what
his paper 2 mark could have been
30
20
10
10 20 30 40 50 60 70 80 90 100
paper 1

Answers: 3
Other questions on the subject: Mathematics
Mathematics, 21.06.2019 23:00, freebyyy7032
Unaware that 35% of the 10000 voters in his constituency support him, a politician decides to estimate his political strength. a sample of 200 voters shows that 40% support him. a. what is the population? b. what is the parameter of interest? state its value c. what is the statistics of the interest? state its value d. compare your answers in (b) and (c) is it surprising they are different? if the politician were to sample another 200 voters, which of the two numbers would most likely change? explain
Answers: 2
Do you know the correct answer?
Questions in other subjects:
Mathematics, 14.07.2019 11:00
Mathematics, 14.07.2019 11:00

Mathematics, 14.07.2019 11:00

Chemistry, 14.07.2019 11:00

History, 14.07.2019 11:00


