


Pies Sold
15. The graph represents the amount of pies sold by a bakery over the
course of one...

Mathematics, 15.01.2021 04:30, manarsadi6
Pies Sold
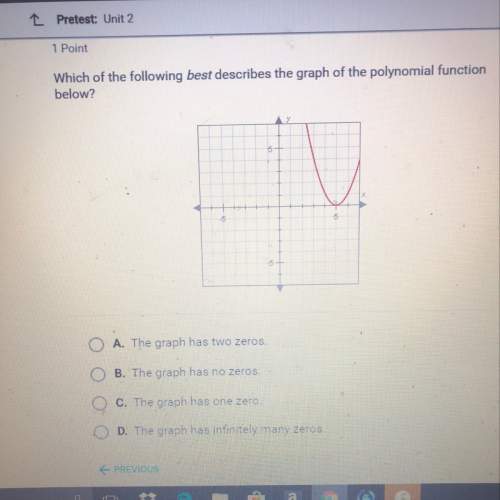
15. The graph represents the amount of pies sold by a bakery over the
course of one day. Determine if each of the following statements is
true or false.
a. The red segment represents sales
True False
increasing at a constant rate.
b. The blue segment represents sales,
True False
decreasing at a constant rate.
C. The green segment represents sales True
False
increasing, but not at a constant rate.
Time

Answers: 1
Other questions on the subject: Mathematics
Mathematics, 21.06.2019 16:00, bailey1025
5× 1/2 = ? a) more than 5 because you are multiplying by a whole number b) 5/10 because you multiply the numerator and denominator by 5 c) less than 5 because you are multiplying by a number that is more than 1 d) less than 5 because you are multiplying by a number that is less than 1
Answers: 3
Mathematics, 21.06.2019 22:00, dest8860
Which sum or difference identity would you use to verify that cos (180° - q) = -cos q? a.) sin (a -b) = sin a cos b – cos a sin b b.) cos (a -b) = cos a cos b – sin a sin b c.) cos (a -b) = cos a cosb + sin a sin b d.) sin (a + b) = sin a cos b + cos a sin b
Answers: 1
Mathematics, 21.06.2019 22:10, willisanthony7815
Acompany manufactures three types of cabinets. it makes 110 cabinets each week. in the first week, the sum of the number of type-1 cabinets and twice the number of type-2 cabinets produced was 10 more than the number of type-3 cabinets produced. the next week, the number of type-1 cabinets produced was three times more than in the first week, no type-2 cabinets were produced, and the number of type-3 cabinets produced was the same as in the previous week.
Answers: 1
Do you know the correct answer?
Questions in other subjects:


