

Mathematics, 04.01.2021 06:30, russianspartan1
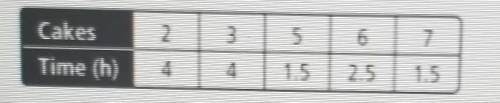
Each day at the bakery, Jack bakes vakes and helps out at the counter. Make a scatter plot of the hours Jake spends at the counter as a function of the number of cakes he bakes. Draw the trend line and chose what the y-intercept of the line represents. Answer the type of correlation the scatter plot shows.
A. average time it takes to bake one cake
B. average number of cakes per hour Jack can bake
C. total time spent baking cakes D. total number of hours Jack works each day
D. total number of hours Jack work each day

Answers: 1


Other questions on the subject: Mathematics
Mathematics, 21.06.2019 16:30, taythestargazer71
What is the name used to describe a graph where for some value of x, there exists 2 or more different values of y?
Answers: 2
Mathematics, 21.06.2019 21:00, almasahagung
Can someone tell me if this is perpendicular? !
Answers: 2
Do you know the correct answer?
Each day at the bakery, Jack bakes vakes and helps out at the counter. Make a scatter plot of the ho...
Questions in other subjects:

History, 23.10.2020 05:01

Chemistry, 23.10.2020 05:01

English, 23.10.2020 05:01
Mathematics, 23.10.2020 05:01

Mathematics, 23.10.2020 05:01


