

Mathematics, 16.12.2020 14:00, edulak5726
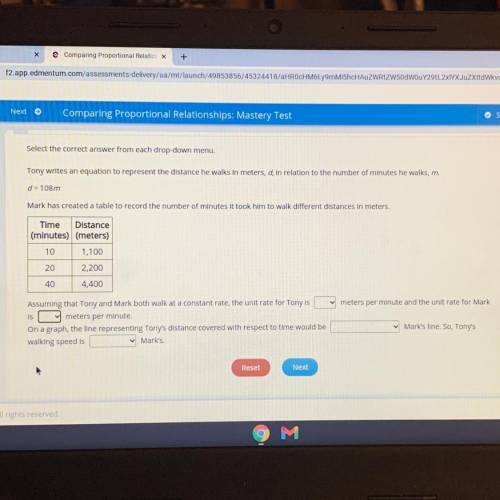
Select the correct answer from each drop-down menu.
Tony writes an equation to represent the distance he walks in meters, d, in relation to the number of minutes he walks, m.
d= 108m
Mark has created a table to record the numnber of minutes It took him to walk different distances In meters.
Distance
(minutes) (meters)
Time
10
20
40
1,100
2,200
4,400
Assuming that Tony and Mark both walk at a constant rate, the unit rate for Tony is vmeters per minute and the unit rate for Mark
is meters per minute.
On a graph, the line representing Tonys distance covered with respect to time would be
walking speed is
v Mark's line. So, Tony's
v Marks.

Answers: 3


Other questions on the subject: Mathematics
Mathematics, 21.06.2019 18:00, aleilyg2005
List the sides of δrst in in ascending order (shortest to longest) if: m∠r =x+28°, m∠s = 2x+16°, and m∠t = x+12°
Answers: 1
Mathematics, 21.06.2019 20:30, elyzeraganitowlkn9
What is the radius of a circle with an area of 78.5 cubic inches? use 3.14 for pie
Answers: 2
Mathematics, 22.06.2019 00:50, issacurlyheadka
Solve the problem by using a venn diagram a group of students were surveyed about their taste in music. they were asked how they like three types of music: rock, country western and jazz. the results are summarized below: no one dislikes all three types of music. six like all three types of music. eleven don’t like country western. sixteen like jazz. three like country western and jazz, but not rock. six don’t like rock. eight like rock and country western. seven don’t like jazz. how many students were surveyed?
Answers: 3
Mathematics, 22.06.2019 01:20, blackboy21
1. why is a frequency distribution useful? it allows researchers to see the "shape" of the data. it tells researchers how often the mean occurs in a set of data. it can visually identify the mean. it ignores outliers. 2. the is defined by its mean and standard deviation alone. normal distribution frequency distribution median distribution marginal distribution 3. approximately % of the data in a given sample falls within three standard deviations of the mean if it is normally distributed. 95 68 34 99 4. a data set is said to be if the mean of the data is greater than the median of the data. normally distributed frequency distributed right-skewed left-skewed
Answers: 2
Do you know the correct answer?
Select the correct answer from each drop-down menu.
Tony writes an equation to represent the distan...
Questions in other subjects:


English, 30.03.2021 05:40
Mathematics, 30.03.2021 05:40

Social Studies, 30.03.2021 05:40
English, 30.03.2021 05:40
Mathematics, 30.03.2021 05:40


English, 30.03.2021 05:40


