

Mathematics, 09.11.2020 03:00, destinyycooper
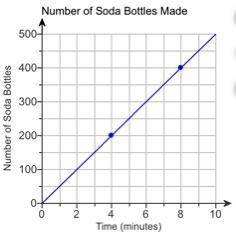
The graph shows the relationship between time and the number of soda bottles a machine can make. Use the points (,) and (,) to find the number of soda bottles the machine can make each minute. Number of Soda Bottles Made 0 2 4 6 8 10 0 100 200 300 400 500 Time (minutes) Number of Soda Bottles A coordinate plane titled Number of Soda Bottles Made is shown. A horizontal axis is labeled Time (minutes) from 0 to 10. A vertical axis is labeled Number of Soda Bottles from 0 to 500. A line rises from left to right starting at the origin, (0, 0), and passes through plotted points (4, 200) and (8, 400). The machine can make nothing soda bottles each minute.

Answers: 1


Other questions on the subject: Mathematics
Mathematics, 21.06.2019 15:30, xxxamslashxxx9
Data was collected on myrtle beach for 11 consecutive days. each day the temperature and number of visitors was noted. the scatter plot below represents this data. how many people visited the beach when the temperature was 84 degrees?
Answers: 1
Mathematics, 21.06.2019 17:30, kleshead
Colby and jaquan are growing bacteria in an experiment in a laboratory. colby starts with 50 bacteria in his culture and the number of bacteria doubles every 2 hours. jaquan starts with 80 of a different type of bacteria that doubles every 3 hours. let x equal number of days. colbys experiment follows the model: a.) y=50*2^x b.) y=50*2^8x c.) y=50*2^12x jaquans experiment follows the model: a.)80*2^x b.)80*2^8x c.)80*2^12x
Answers: 3
Mathematics, 21.06.2019 18:50, karen718
Abag contains 4 red, 7 blue and 5 yellow marbles. event a is defined as drawing a yellow marble on the first draw and event b is defined as drawing a blue marble on the second draw. if two marbles are drawn from the bag, one after the other and not replaced, what is p(b|a) expressed in simplest form? a. 7/16 b. 7/15 c. 14/16 d. 14/15
Answers: 1
Do you know the correct answer?
The graph shows the relationship between time and the number of soda bottles a machine can make. Use...
Questions in other subjects:


English, 22.06.2019 17:30

Biology, 22.06.2019 17:30


