

Mathematics, 27.10.2020 09:30, Lawrence101
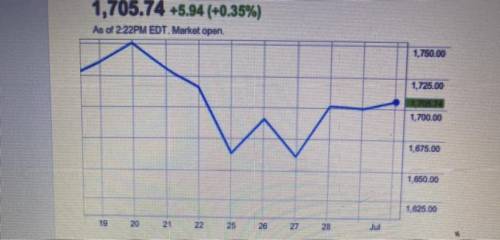
Line graphs show price trends over different time periods. What data points are used to create a line graph on the stock quote shown?
The line graph is created using the_?
of the stock each_?
Close price
Open price
Volume
_
Day
Month

Answers: 3


Other questions on the subject: Mathematics
Mathematics, 21.06.2019 22:00, Isaiahgardiner5143
Arefrigeration system at your company uses temperature sensors fixed to read celsius (°c) values, but the system operators in your control room understand only the fahrenheit scale. you have been asked to make a fahrenheit (°f) label for the high temperature alarm, which is set to ring whenever the system temperature rises above –10°c. what fahrenheit value should you write on the label?
Answers: 3
Mathematics, 21.06.2019 22:30, 1930isainunez
How can constraints be used to model a real-world situation?
Answers: 1
Mathematics, 21.06.2019 23:30, stevenssimeon30
Jane has 5 nickels. john has 3 dimes. jane says she has a greater amount of money. with the information given, is she correct?
Answers: 3
Do you know the correct answer?
Line graphs show price trends over different time periods. What data points are used to create a lin...
Questions in other subjects:

Mathematics, 28.09.2020 01:01
Mathematics, 28.09.2020 01:01


Social Studies, 28.09.2020 01:01
Mathematics, 28.09.2020 01:01
Mathematics, 28.09.2020 01:01


