

Mathematics, 22.10.2020 18:01, honeysenpai6
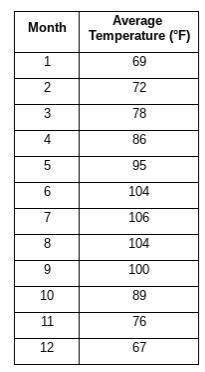
EDGE 2020 The average monthly high temperatures for Phoenix, Arizona from the years 1981-2010 are shown in the table below, with the value 1 representing the month of January, and the value of 12 representing the month of December. Complete the following steps to model the curve using the sine function.
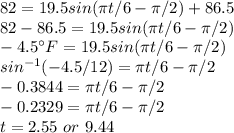
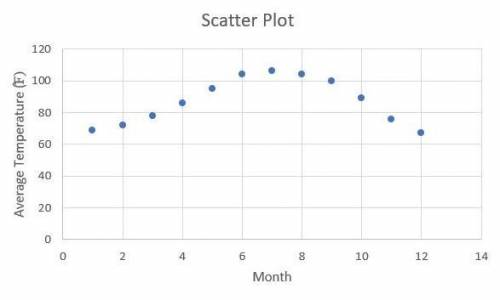
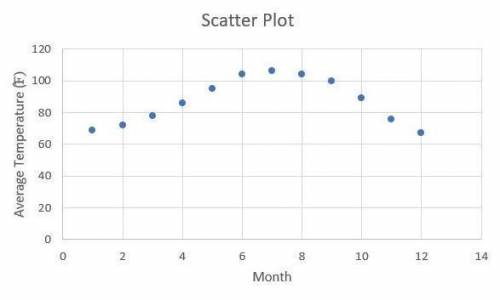
a. Make a scatterplot of the data.
b. What is the minimum temperature in the data set?
c. What is the maximum temperature in the data set?
d. What is the vertical shift, k, for the data set?
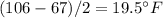
e. What is the amplitude, a, for the data set?
f. What is the period and frequency factor for the data set?
g. What is the phase shift for the data set?
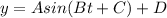
h. Write an equation using the sine function that models this data set.
i. When would you expect the temperature in Phoenix to be 82°?

Answers: 1

 B =
B = 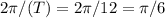 t = 12
C =
t = 12
C =  D =
D = 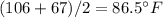


Other questions on the subject: Mathematics
Mathematics, 21.06.2019 20:40, Nyasiahenry
The roots of the function f(x) = x2 – 2x – 3 are shown. what is the missing number?
Answers: 2
Mathematics, 21.06.2019 22:30, BigGirlsTheBest
At the beginning of year 1, carlos invests $600 at an annual compound interest rate of 4%. he makes no deposits to or withdrawals from the account. which explicit formula can be used to find the account's balance at the beginning of year 5? what is, the balance?
Answers: 1
Do you know the correct answer?
EDGE 2020 The average monthly high temperatures for Phoenix, Arizona from the years 1981-2010 are sh...
Questions in other subjects:


Mathematics, 03.06.2021 18:00
English, 03.06.2021 18:00
English, 03.06.2021 18:00


