

Mathematics, 12.10.2019 19:00, gd9075
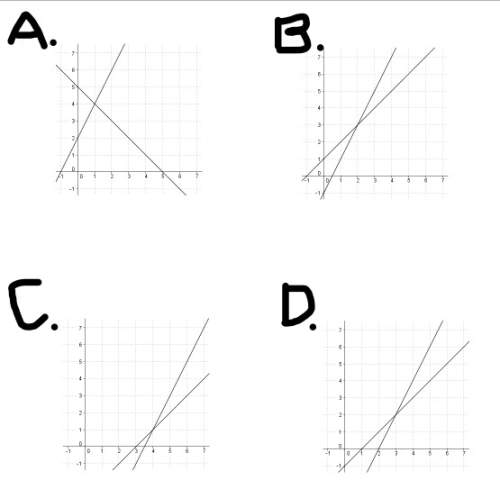
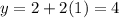
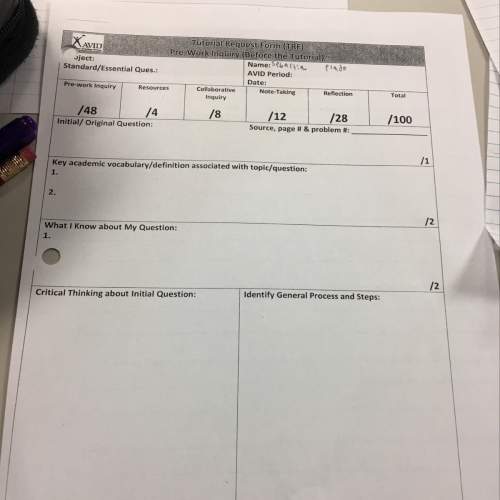
Hannah bought x boxes of cereal boxes and y cartons of milk. the number of milk cartons she bought was 2 more than twice the number of cereal boxes she bought. the total number of cereal boxes and milk cartons she bought was 5. which graph best shows the number of cereal boxes and milk cartons hannah bought?

Answers: 3
 -----> equation A
 -----> equation B
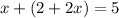


Other questions on the subject: Mathematics
Mathematics, 21.06.2019 22:00, alyssa32900
Sara has been reading about different types of financial grants, including federal pell grants, academic competitiveness grants, smart grants, and teach grants. which statement about these grants is true? filling out a fafsa will not her apply for these grants. she will not have to pay back any funds she receives from these grants. these grants only go to students with less than a 3.0 gpa. she will have to pay back all the funds she receives from these grants.
Answers: 2
Mathematics, 21.06.2019 22:50, sarbjit879
Which linear inequality is represented by the graph?
Answers: 1
Mathematics, 22.06.2019 01:10, 24nelsoaddh
If the probability of an event happening is 65% then the probability this event does not occur?
Answers: 1
Do you know the correct answer?
Hannah bought x boxes of cereal boxes and y cartons of milk. the number of milk cartons she bought w...
Questions in other subjects:

History, 03.12.2020 09:30


Chemistry, 03.12.2020 09:30
History, 03.12.2020 09:30
Mathematics, 03.12.2020 09:30


