

Mathematics, 26.06.2020 15:01, xxxanitaxxx
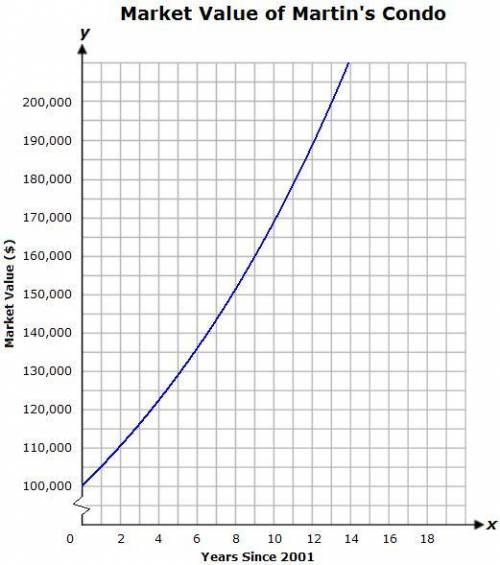
Martin purchased a condo below market value in 2001. He paid $92,500 for the condo even though the market value of the condo was much higher. In 2014, Martin transferred to another city for work and had to sell his condo. The market value of his condo increased over time, as shown in the graph below, where the y-axis represents the market value of the condo, in dollars, and the x-axis represents the number of years since 2001. Now the answers are drop down questions, The first one:The initial market value of the condo is... Answers:107500, 1000000, 92500, 7500 Question 2: The percent increase per year of the market value of the condo is. Answers:.05, 95, 50, .5, 5, .95 Question 3:The interval on which Martin owned the condo is...≤ x ≤ . (2 drop down answers) Answers for the first drop down, 2014, 0, 14, 13, 2001, 1 Answer for the second drop down, 1, 13, 14, 0, 2014, 2001. Thank you for answering Answers

Answers: 3


Other questions on the subject: Mathematics
Mathematics, 21.06.2019 19:00, anonymous115296
How many solutions does the nonlinear system of equations graphed bellow have?
Answers: 1
Mathematics, 21.06.2019 20:00, AleOfficial101
Hell . what are the solutions to `10x^2 - 38x - 8 = 0`? is this when i find the factors and use the numbers within the factors to determine the zeros? i hope that made sense lol
Answers: 2
Do you know the correct answer?
Martin purchased a condo below market value in 2001. He paid $92,500 for the condo even though the m...
Questions in other subjects:

Mathematics, 04.10.2020 08:01

English, 04.10.2020 08:01


