

Mathematics, 12.06.2020 18:57, destinyleisantos
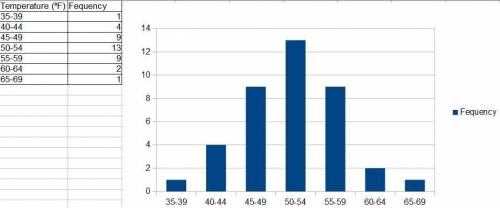
Does the frequency distribution appear to have a normal distribution? Explain. Temperature (degreesF) Frequency 35 dash 39 1 40 dash 44 4 45 dash 49 9 50 dash 54 13 Temperature (degreesF) Frequency 55 dash 59 9 60 dash 64 2 65 dash 69 1 Choose the correct answer below. A. No, because the frequencies start low, proceed to one or two high frequencies, then decrease to a low frequency, and the distribution is not symmetric. B. No, because the frequencies start low, proceed to one or two high frequencies, then decrease to a low frequency, and the distribution is approximately symmetric. C. Yes, because the frequencies start low, proceed to one or two high frequencies, then increase to a maximum, and the distribution is not symmetric. D. Yes, because the frequencies start low, proceed to one or two high frequencies, then decrease to a low frequency, and the distribution is approximately symmetric.

Answers: 1


Other questions on the subject: Mathematics
Mathematics, 21.06.2019 14:00, zoeyanai1
30 in the diagram line e and made parallel to each other and line p and q are transversal. use properties of special angles formed by parallel lines and their transversals to find the missing angle measures. m< 3=65 m< 15=120 m< 7= m< 4= m< 6= m< 1= m< 16= m< 18= m< 21= m< 10= m< 11= m< 12=
Answers: 1
Mathematics, 21.06.2019 18:00, nefertitihorne12
Me asap! what is the slope of this line? enter your answer in the box.
Answers: 2
Mathematics, 21.06.2019 20:30, cogger9348
3.17 scores on stats final. below are final exam scores of 20 introductory statistics students. 1 2 3 4 5 6 7 8 9 10 11 12 13 14 15 16 17 18 19 20 57, 66, 69, 71, 72, 73, 74, 77, 78, 78, 79, 79, 81, 81, 82, 83, 83, 88, 89, 94 (a) the mean score is 77.7 points. with a standard deviation of 8.44 points. use this information to determine if the scores approximately follow the 68-95-99.7% rule. (b) do these data appear to follow a normal distribution? explain your reasoning using the graphs provided below.
Answers: 1
Do you know the correct answer?
Does the frequency distribution appear to have a normal distribution? Explain. Temperature (degreesF...
Questions in other subjects:


Biology, 23.07.2019 19:30


Business, 23.07.2019 19:40
Mathematics, 23.07.2019 19:40

Social Studies, 23.07.2019 19:40


