


24. SHORT ANSWER The line graph shows
the performance of a stock over a 5-day
period. Desc...

Mathematics, 19.05.2020 02:58, tiwaribianca475
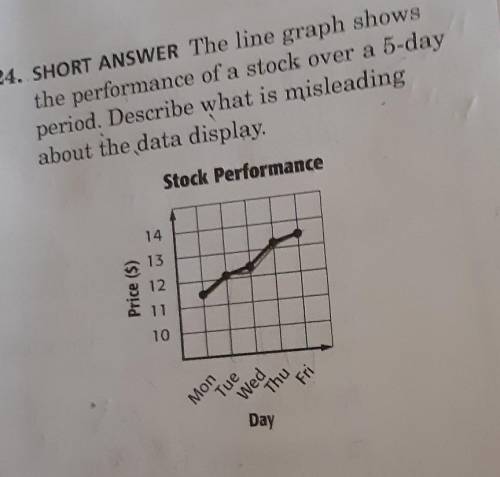
24. SHORT ANSWER The line graph shows
the performance of a stock over a 5-day
period. Describe what is misleading
about the data display,
Stock Performance

Answers: 1
Other questions on the subject: Mathematics
Mathematics, 21.06.2019 13:40, Valduarte07
Solve the equation 3x2 + 19x + 9 = 0 to the nearest tenth.
Answers: 1
Do you know the correct answer?
Questions in other subjects:


History, 04.07.2019 12:00
History, 04.07.2019 12:00

Mathematics, 04.07.2019 12:00


