

Mathematics, 05.05.2020 12:00, jameslinimk
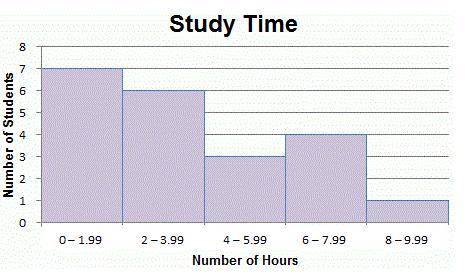
A survey of sixth-grader students recorded how many hours students studied each week. The histogram below displays the collected information. Which interval shows the greatest number of students? 0 - 1.99 2 - 3.99 4 - 5.99 6 - 7.99

Answers: 1


Other questions on the subject: Mathematics
Mathematics, 21.06.2019 20:20, oscarmasinde44
Abag contains 3 red marbles, 2 blue marbles, and 2 green marbles. one marble is picked, then another marble. assume that the selections are made with replacement. a) find the probability of picking two red marbles with replacement. b) find the probability of picking a red marble and a blue marble. assume the selections are made without replacement. c) find the probability of picking two red marbles without replacement. d) find the probability of picking a red marble and a blue marble without replacement.
Answers: 1
Mathematics, 21.06.2019 23:10, roxannaemigdio3850
Point s lies between points r and t on . if rt is 10 centimeters long, what is st? 2 centimeters 4 centimeters 6 centimeters 8 centimeters
Answers: 2
Mathematics, 22.06.2019 04:00, AmbitiousAndProud
Which of the following questions describes the equation g + (-4) = -5? a)what number, when added to negative four, is equal to negative five? b)what number, when added to negative five, is equal to negative four? c)what number, when subtracted from negative four, is equal to negative five? d)what number, when subtracted from negative five, is equal to negative four?
Answers: 1
Do you know the correct answer?
A survey of sixth-grader students recorded how many hours students studied each week. The histogram...
Questions in other subjects:

Biology, 25.07.2019 14:20
Mathematics, 25.07.2019 14:20

Chemistry, 25.07.2019 14:20
Biology, 25.07.2019 14:20


