

Mathematics, 16.04.2020 22:53, madi1820
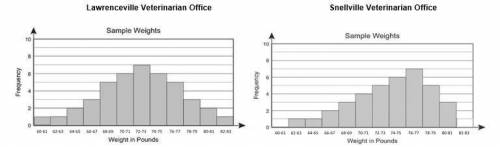
The two histograms below show the weights of dogs at two different veterinarian offices.
The median weight of dogs at Lawrenceville’s Veterinarian Office is 72 pounds. The median weight of dogs at Snellville’s Veterinarian Office is 76 pounds. Determine which of the following statements are true:
A. The mean weight of dogs at Lawrenceville’s Veterinarian Office is about 68 pounds and the mean weight of dogs at Snellville’s Veterinarian Office is about 72 pounds.
B. The mean weight of dogs at Lawrenceville’s Veterinarian Office is about 72 pounds and the mean weight of dogs at Snellville’s Veterinarian Office is about 73 pounds.
C. The mean weight of dogs at Lawrenceville’s Veterinarian Office is about 72 pounds and the mean weight of dogs at Snellville’s Veterinarian Office is about 76 pounds.
D. The mean weight of dogs at Lawrenceville’s Veterinarian Office is about 76 pounds and the mean weight of dogs at Snellville’s Veterinarian Office is about 72 pounds.
*could be more than one answer*

Answers: 2


Other questions on the subject: Mathematics
Mathematics, 21.06.2019 21:40, Fangflora3
The sides of a parallelogram are 24cm and 16cm. the distance between the 24cm sides is 8 cm. find the distance between the 16cm sides
Answers: 3
Mathematics, 22.06.2019 00:00, GERIANNCAYER
Aclothing designer is selecting models to walk the runway for her fashion show. the clothes she designed require each model’s height to be no more than y inches from 5 feet 10 inches, or 70 inches. which graph could be used to determine the possible variance levels that would result in an acceptable height, x?
Answers: 2
Do you know the correct answer?
The two histograms below show the weights of dogs at two different veterinarian offices.
Questions in other subjects:
Mathematics, 27.01.2020 08:31


Physics, 27.01.2020 08:31

History, 27.01.2020 08:31
Mathematics, 27.01.2020 08:31


