


y ≥ 2x − 3

Mathematics, 19.11.2019 19:31, fabio37
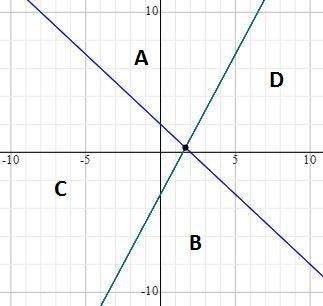
The boundary lines for the system of inequalities is given in the graph.
y ≥ 2x − 3
y ≤ −x + 2
which region represents the solution to the system of inequalities?
a)
region a
b)
region b
c)
region c
d)
region d

Answers: 2
Other questions on the subject: Mathematics
Mathematics, 21.06.2019 15:00, kkruvc
Ascatterplot is produced to compare the size of a school building to the number of students at that school who play an instrument. there are 12 data points, each representing a different school. the points are widely dispersed on the scatterplot without a pattern of grouping. which statement could be true
Answers: 1
Mathematics, 21.06.2019 23:00, jayjay2006
What is the value of n in the equation -1/2(2n+4)+6=-9+4(2n+1)
Answers: 1
Do you know the correct answer?
The boundary lines for the system of inequalities is given in the graph.
y ≥ 2x − 3
y ≥ 2x − 3
Questions in other subjects:


Chemistry, 13.09.2019 00:30

Biology, 13.09.2019 00:30
Mathematics, 13.09.2019 00:30


History, 13.09.2019 00:30


