


Analyze the graph below to identify the key features of the logarithmic function.
graph begins...

Mathematics, 09.08.2019 19:10, lizzyhearts
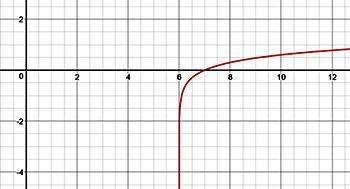
Analyze the graph below to identify the key features of the logarithmic function.
graph begins in the fourth quadrant near the line x equals 6 and increases rapidly while crossing the ordered pair 7, 0. the graph then begins to increase slowly throughout the first quadrant.
the x‐intercept is y = 7, and the graph approaches a vertical asymptote at y = 6.
the x‐intercept is x = 7, and the graph approaches a vertical asymptote at x = 6.
the x‐intercept is y = −7, and the graph approaches a vertical asymptote at y = −6.
the x‐intercept is x = −7, and the graph approaches a vertical asymptote at x = −6

Answers: 1
Other questions on the subject: Mathematics
Do you know the correct answer?
Questions in other subjects:


English, 30.03.2020 17:40

Mathematics, 30.03.2020 17:40


