

Mathematics, 28.01.2020 21:06, april861
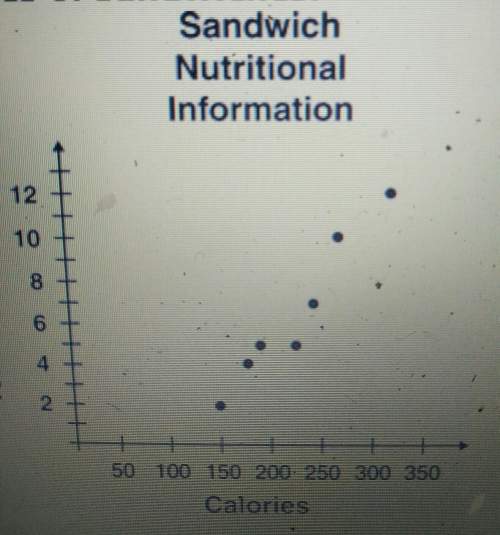
The graphy below shows the relationshio between the numbers of calories and the total amount in fat in different types of sandwiches. which trendnbest describes the relationshio in the graph a.) the points have a negative trend and are nonlinear b ) the points have a negative trend and are most likely linear c.) the points have a positive trend and are most likely linear d ) the points have a positive trend and are nonlinear

Answers: 3


Other questions on the subject: Mathematics
Mathematics, 21.06.2019 18:30, gthif13211
1.two more than the quotient of a number and 6 is equal to 7 use the c for the unknown number translate the sentence into an equation
Answers: 1
Mathematics, 21.06.2019 19:30, Flaka2809
Asurvey of 45 teens found that they spent an average of 25.6 hours per week in front of a screen (television, computer, tablet, phone, based on the survey’s sample mean, which value could be the population mean? 2.3 hours 27.4 hours 75.3 hours 41.5 hours
Answers: 1
Do you know the correct answer?
The graphy below shows the relationshio between the numbers of calories and the total amount in fat...
Questions in other subjects:

Physics, 18.09.2021 20:10
Mathematics, 18.09.2021 20:10
Mathematics, 18.09.2021 20:10


Engineering, 18.09.2021 20:10
Biology, 18.09.2021 20:10


