

Social Studies, 16.02.2022 22:20, peno211
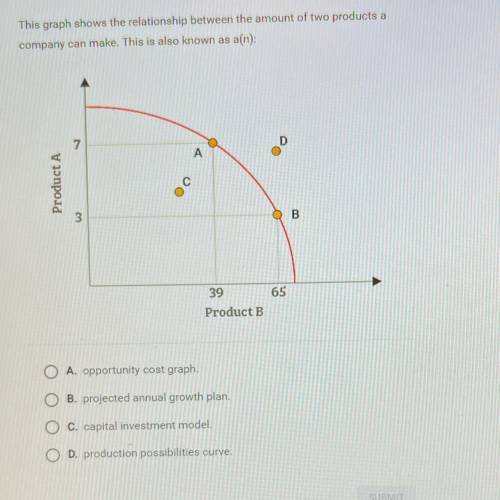
This graph shows the relationship between the amount of two products a
company can make. This is also known as a(n)
O A. opportunity cost graph.
O B. projected annual growth plan.
O C. capital investment model.
O D. production possibilities curve.
Asap please

Answers: 2


Other questions on the subject: Social Studies
Social Studies, 21.06.2019 16:00, lazavionadams81
Select the word from the list that best fits the definition a city-state in ethiopia
Answers: 3
Social Studies, 22.06.2019 00:10, jaydenbrock
Which nims management characteristic to eliminate confusion caused by conflicting instructions? a. management by objectives b. chain of command and unity of command c. information and intelligence management d. accountability
Answers: 1
Do you know the correct answer?
This graph shows the relationship between the amount of two products a
company can make. This is a...
Questions in other subjects:

English, 04.08.2019 15:00

Mathematics, 04.08.2019 15:00
Mathematics, 04.08.2019 15:00
Mathematics, 04.08.2019 15:00

History, 04.08.2019 15:00

Biology, 04.08.2019 15:00
Social Studies, 04.08.2019 15:00


