

Social Studies, 03.02.2021 18:00, Har13526574
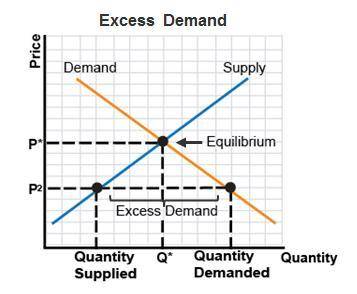
The graph shows excess demand.
A graph titled Excess supply has quantity on the x-axis and price on the y-axis. A line with positive slope represents supply and a line with negative slope represents demand. The lines intersect at the point of equilibrium (p star, Q star). A point on the demand line is (P 2, quantity demanded) and a point on the supply line is (P 2, quantity supplied). Both points are lower than the point of equilibrium. Excess demand is indicated between the 2 points.
Which needs to happen in order to stop disequilibrium from occurring?
Q needs to be coordinated with supply.
Q needs to be coordinated with demand.
The price of goods needs to be increased.
The price of goods needs to be decreased.

Answers: 1


Other questions on the subject: Social Studies
Social Studies, 22.06.2019 07:30, liloleliahx2
U. s. history 1.documentary analysis what steps did taylor’s family take to prepare her freedom
Answers: 2
Social Studies, 22.06.2019 11:20, 666isabella666
Ssignment 4: contemporary issues in modern police operations and the policing due week 10 and worth 180 points select one to two (1-2) contemporary issues in modern police operations and examine the related law enforcement agencies, change, and efficiency.
Answers: 2
Do you know the correct answer?
The graph shows excess demand.
A graph titled Excess supply has quantity on the x-axis and price on...
Questions in other subjects:

Mathematics, 20.05.2021 04:40

Mathematics, 20.05.2021 04:40


