


Which graph represents the system of inequalities?
y- 2x < -3
y-4 <...

SAT, 02.12.2019 10:31, firstone04kr
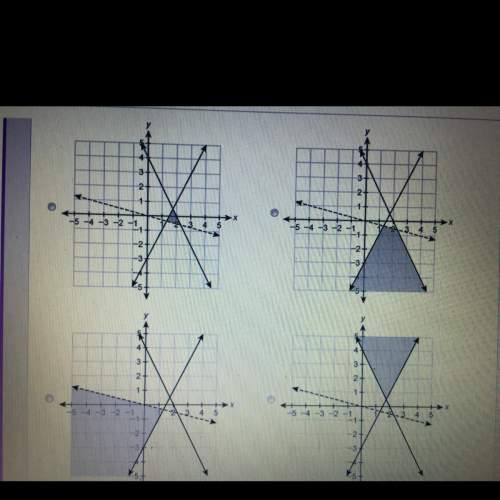
Which graph represents the system of inequalities?
y- 2x < -3
y-4 < -2x
y > -1/4x

Answers: 1
Other questions on the subject: SAT
SAT, 26.06.2019 03:00, corlissquillen13
Registrars maintain high a. standardized tests b. faculty payrolls c. transcripts d. sporting facilities
Answers: 1
SAT, 27.06.2019 22:00, lalaokawami0912
Blank is the amount of energy in a sound wave per unit of time and is also related to the loudness of a sound
Answers: 1
SAT, 28.06.2019 11:00, kayleenprmartinez100
Apopulation of bolts has a mean thickness of 20 millimeters, with a population standard deviation of .01 millimeters. give, in millimeters, a minimum and a maximum thickness that includes 68% of the population of bolts.
Answers: 3
Do you know the correct answer?
Questions in other subjects:

English, 02.02.2021 01:00

Health, 02.02.2021 01:00

English, 02.02.2021 01:00
English, 02.02.2021 01:00

Mathematics, 02.02.2021 01:00
Mathematics, 02.02.2021 01:00


