


The graph is tied to the reading
here is the reading for the question
students in a p...

Physics, 06.12.2021 14:50, tasa123l14
The graph is tied to the reading
here is the reading for the question
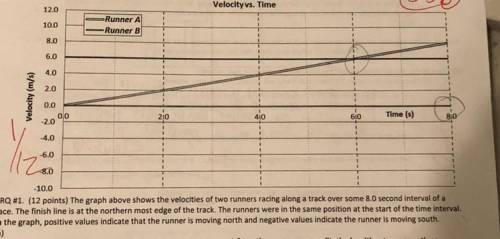
students in a physics class observing the race note that each runner maintains the same acceleration from the start ofthe 8.0 second interval until they each reach the finish line where each of the runners slows to a stop. Two students inthe class make the following claims about the runners’ accelerations from the start of the 8.0 second interval until bothrunners are at rest.
Student 1:“Runner A has a positive acceleration until reaching the finish line and then a negative acceleration aftercrossing the finish line in order to “undo” all of the positive velocity she gained. Since Runner B neverhad any positive acceleration, she doesn’t need any negative acceleration to slow to a stop; heracceleration will be zero the whole time.”
Student 2:“But negative values mean away south in this case – how could runner A be turning around? I think bothrunners must have positive accelerations the whole time since they are always moving north.”
For part (c), do not simple repeat the students’ arguments in your answers.
here are the questions:
i. Which aspects of student 1’s reasoning, if any, are correct? Explain your answer.

Answers: 2
Other questions on the subject: Physics
Physics, 21.06.2019 22:30, droidd133
Fft review: linspace, fs, fftshift, nfft 1. generate one second of a cosine of w,-10hz sampled at f, = 100hz and assign it to x. define a tt as your time axis 2. take 64 points fft. 3. as you remember, the dft (which the fft implements) computes n samples of s2t where k-0,1,2, n -1. plot the magnitude of this 64-points fft at range 0 to 63, what do you think of this graph? 4â·to get the x-axis into a hz-frequency form, plot this 64-points fft between-50 to 50 (the 100hz sampling rate) and have n-points between them. 5. according to your figure, what frequency is this cosine wave at? 6. remember that the fft is evaluating from 0 to 2ď€. we are used to viewing graphs from-ď€ to ď€. therefore, you need to shift your graph. 7. now according to your shifted graph. what frequency is this at? 8. note that the spikes have long drop-offs? try a 1024-point dft. note that the peak is closer to 10 and the drop-off is quicker. although, now sidelobes are an issue
Answers: 2
Physics, 22.06.2019 06:40, miaglory3828
Light traveling in a medium with a refractive index 1.19 is incident on a plate of another medium with index of refraction 1.79. at what angle of incidence is the reflected light fully polarized?
Answers: 2
Physics, 22.06.2019 15:20, avree4722
Abag of potato chips contains 2.00 l of air when it is sealed at sea level at a pressure of 1.00 atm and a temperature of 20.0 deg c. what will be the volume of the air in the bag if you take it with you, still sealed, to the mountains where the temperature is 7.00 deg c and atmospheric pressure is 70.0 kpa? assume that the bag behaves like a balloon and that the air in the bag is in thermal equilibrium with the outside air.
Answers: 3
Do you know the correct answer?
Questions in other subjects:

Mathematics, 08.07.2021 17:30

Computers and Technology, 08.07.2021 17:30
Mathematics, 08.07.2021 17:30
Mathematics, 08.07.2021 17:30


History, 08.07.2021 17:30


