


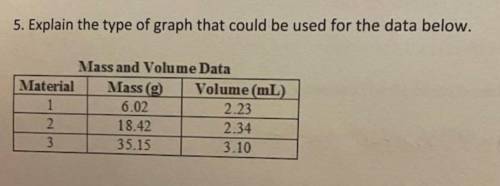
Explain the type of graph that could be used for the data below.
...

Physics, 13.05.2021 05:40, deanazilyiah
Explain the type of graph that could be used for the data below.

Answers: 3
Other questions on the subject: Physics
Physics, 21.06.2019 16:30, Jay23456677888
The mass of a muon is 207 times the electron mass; the average lifetime of muons at rest is 2.21 μs. in a certain experiment, muons moving through a laboratory are measured to have an average lifetime of 7.04 μs. for the moving muons, what are (a) β (b) k, and (c) p? the rest energy of the electron is 0.511 mev.
Answers: 2
Physics, 21.06.2019 22:30, dyamondgeorge1oy4nex
During takeoff, the sound intensity level of a jet engine is 170db at a distance of 34 m. what's the sound intensity level at a distance of 1.0 km?
Answers: 2
Physics, 22.06.2019 05:30, trevorhenyan51
Suppose you have three polarizing filters, with the second at an angle of 42∘ to the first and the third at an angle of 90∘ to the first. by what perfect will the original intensity of unpolarized light be reduced to after passing through all three filters?
Answers: 2
Physics, 22.06.2019 10:20, yofavvlele
Assume that a person skiing high in the mountains at an altitude of h = 15100 ft takes in the same volume of air with each breath as she does while walking at sea level. determine the ratio of the mass of oxygen inhaled for each breath at this high altitude compared to that at sea level. assume that the air composition (i. e. % of air that is oxygen) is the same at sea level as it is at 15100 ft.
Answers: 2
Do you know the correct answer?
Questions in other subjects:

Biology, 05.04.2020 04:43
Biology, 05.04.2020 04:43

Mathematics, 05.04.2020 04:44
Mathematics, 05.04.2020 04:44

Social Studies, 05.04.2020 04:44

English, 05.04.2020 04:44
Mathematics, 05.04.2020 04:44


