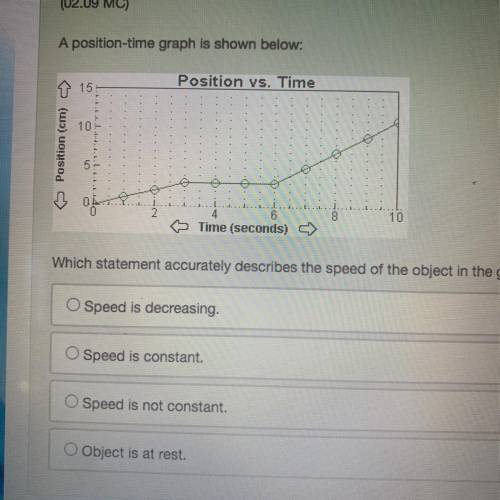
A position-time graph is shown below:
Position vs. Time
T 15
10
Time (seconds)
Which statement accurately describes the speed of the object in the graph above over the 10 seconds?
O Speed is decreasing.
O Speed is constant.
O Speed is not constant.
O Object is at rest.
Question 5 Multiple Choice Worth 2 points)
Assume this car is driven off a cliff . how many arrows of force need to be drawn in the free body diagram? assume no air resistance -five -one -three -four
Aball thrown by ginger is moving upward through the air. diagram a shows a box with a downward arrow. diagram b shows a box with an upward arrow. diagram c shows a box with a downward and upward arrow equal in size. diagram d shows a box with a downward and upward arrow with the downward arrow larger in size. which force diagram represents the forces on the ball? you may neglect the effects of air resistance.