

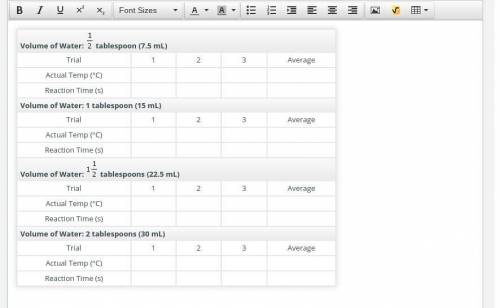
Next, you’ll test your hypothesis by examining the reaction times of vinegar and baking soda in boiling water using four different concentrations of the reactants. You’ll vary the concentrations by using tablespoon (7.5 milliliters), 1 tablespoon (15 milliliters), tablespoons (22.5 milliliters), and 2 tablespoons (30 milliliters) of water. Note that you will use the same amounts of vinegar and baking soda for each trial.
Gather all the materials, and proceed with these steps:
Boil at least 1 cup (240 milliliters) of water on a stove, on a hot plate, or in a microwave oven.
Measure and record the actual temperature of the water.
Measure the required amount of boiling water into the cup.
Add teaspoon (1.5 grams) baking soda to the water, and stir until it is dissolved. The resulting solution will be clear.
Measure out 1 tablespoon (15 milliliters) of vinegar, but do not pour it into the cup yet.
Very quickly, do all of the following:
a. Pour the measured vinegar into the cup.
b. Start the stopwatch.
c. Stir or carefully swirl the substances in the cup.
The chemical reaction will produce bubbles. You’ll be able to see the bubbles and hear them pop. Watch and listen for when the reaction stops. When it looks and sounds like it has finished, stop the stopwatch.
Record the reaction time in the data table.
Discard the solution down the drain, and rinse the cup.
Repeat this procedure, doing three trials at each concentration. Record the average temperature and reaction time for each set of the three trials. Read this math review for a refresher on finding averages.

Answers: 1


Other questions on the subject: Physics
Physics, 21.06.2019 20:00, VampireQueen01
Player kicks a soccer ball from ground level and sends it flying at an angle of 30 degrees at a speed of 26 m/s. what is the horizontal velocity component of the ball to the nearest tenth of a m/s?
Answers: 2
Physics, 21.06.2019 22:30, droidd133
Fft review: linspace, fs, fftshift, nfft 1. generate one second of a cosine of w,-10hz sampled at f, = 100hz and assign it to x. define a tt as your time axis 2. take 64 points fft. 3. as you remember, the dft (which the fft implements) computes n samples of s2t where k-0,1,2, n -1. plot the magnitude of this 64-points fft at range 0 to 63, what do you think of this graph? 4â·to get the x-axis into a hz-frequency form, plot this 64-points fft between-50 to 50 (the 100hz sampling rate) and have n-points between them. 5. according to your figure, what frequency is this cosine wave at? 6. remember that the fft is evaluating from 0 to 2ď€. we are used to viewing graphs from-ď€ to ď€. therefore, you need to shift your graph. 7. now according to your shifted graph. what frequency is this at? 8. note that the spikes have long drop-offs? try a 1024-point dft. note that the peak is closer to 10 and the drop-off is quicker. although, now sidelobes are an issue
Answers: 2
Physics, 22.06.2019 11:00, bumpydumper
The dot diagram represents the motion of the motorcycle as it moves from left to right
Answers: 3
Do you know the correct answer?
Next, you’ll test your hypothesis by examining the reaction times of vinegar and baking soda in boil...
Questions in other subjects:

Mathematics, 30.06.2019 04:30

Biology, 30.06.2019 04:30

Arts, 30.06.2019 04:30
Mathematics, 30.06.2019 04:30

Mathematics, 30.06.2019 04:30

Chemistry, 30.06.2019 04:30


