

Physics, 30.10.2020 17:00, janayshas84
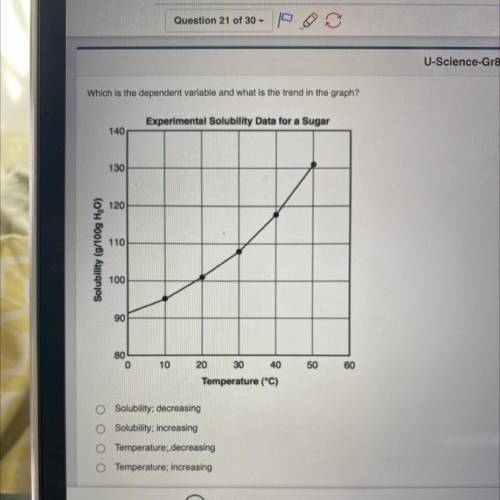
Which is the dependent variable and what is the trend in the graph?
Experimental Solubility Data for a Sugar
140
130
120
110
Solubility (g/100g H,0)
100
90
80
0
10
50
60
20 30 40
Temperature (*C)
Solubility; decreasing
Solubility; increasing
Temperature; decreasing
Temperature; increasing

Answers: 3


Other questions on the subject: Physics
Physics, 21.06.2019 22:30, leannamat2106
According to the tide table below what time of day will the highest tide occur?
Answers: 1
Physics, 22.06.2019 07:40, Alex9089435028
Astudent creates a model of a closed ecosystem by filling a glass tank half full with water, then adding 10 snails and two small aquatic plants. the next day, all the snails are dead. what is the most likely cause of their death?
Answers: 3
Physics, 22.06.2019 12:50, johnthevarietyboy200
The heliocentric and the geocentric models of the solar system included these central principles
Answers: 1
Do you know the correct answer?
Which is the dependent variable and what is the trend in the graph?
Experimental Solubility Data fo...
Questions in other subjects:


Mathematics, 19.09.2019 15:50

History, 19.09.2019 15:50
Physics, 19.09.2019 15:50
Mathematics, 19.09.2019 15:50


