

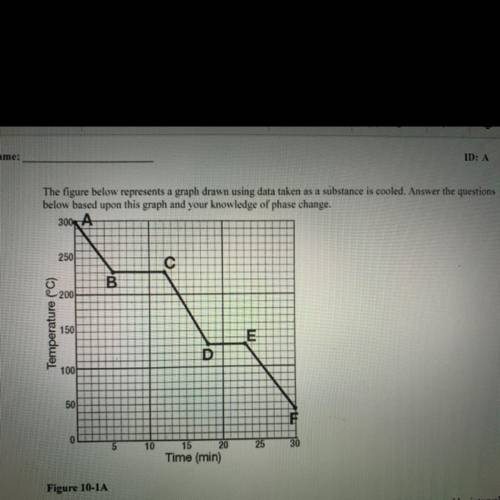
7. For Figure 10-1A, the portion of the graph during which the substance is all solid is represented by interval:
a. A-B
b. D-E
C-D
d. E-F
8. The minimum time required for the substance in Figure 10-1A to change from all gas to all liquid is:
a.30 minutes.
b. 12 minutes.
c. 8 minutes.
d. 7 minutes.
9. The boiling point of the substance Figure 10-1A is:
a. 40°C
b. 130°C
c. 230°C
d. 300°C
10. The melting point of the substance in Figure 10-1A is:
a. 40°C
b. 130°C
c. 230°C
d. 300°C

Answers: 3


Other questions on the subject: Physics
Physics, 22.06.2019 11:30, jacob12049
If the textbook weighs 19.6 newtons on venus, what is the strength of gravity on venus?
Answers: 1
Physics, 22.06.2019 16:30, jetblackcap
When conducting an investigation to determine which type of fertilizer produces the most flowers on a plant, which variable would be graphed on the x-axis once you collected the data? a. type of fertilizer b. amount of flowers c. amount of water d. number of days that the plants grew
Answers: 1
Do you know the correct answer?
7. For Figure 10-1A, the portion of the graph during which the substance is all solid is represented...
Questions in other subjects:

Mathematics, 10.11.2020 18:50


Mathematics, 10.11.2020 18:50

Mathematics, 10.11.2020 18:50

English, 10.11.2020 18:50


