


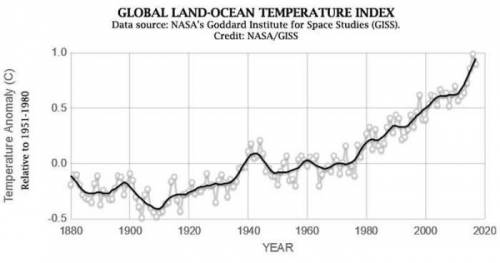
Fill in the table below based on the global temperature record:
Time period Number of yea...

Physics, 05.05.2020 16:29, 1232444553
Fill in the table below based on the global temperature record:
Time period Number of years with mean Temp. > 0° to +1° above mean Number of years with mean Temp. more than +1° above mean Number of years with mean Temp. < 0° to -1° below mean
1880-1899 0 0 20
1900-1919
1920-1939
1940-1959
1960-1979
1980-1999
2000-2019
Have global temperatures risen or fallen since 1900, and how much have they changed (how many temperature degrees) .
What is the size of the overall temperature changes in USA (how many degrees has it changed, see previous graph!) and how does this compare to the size of the global temperature change calculated in the previous question?
Are the years with the highest and lowest annual temperatures the same on both graphs (are the same in the USA versus in the world)? If not how much do they differ?
Are the points with the highest and lowest 5 year average temperatures the same on both graphs? If not how much to they differ (i. e. how much time is there between them)?
Suggest a reason why mean annual temperature in USA may differ from mean global temperature. (Hint: think about USA’s geographic position on earth, how is USA different from the average values you would get looking at all of earth, what’s special about it)

Answers: 3
Other questions on the subject: Physics
Physics, 21.06.2019 17:00, laurentsupreme
In a closed system, the total energy prior to an energy transformation is the total energy after. a. equal to b. unrelated to c. greater than d. less than
Answers: 2
Physics, 22.06.2019 12:30, jaejaeJae941
Urgent pls a. coal consumption levels off and remains flat. b. petroleum, natural gas, and renewables show an increase in consumption c. more nonrenewable resources continued to be consumed than renewable. d. there is little projected increase in nuclear energy use. e. carbon dioxide emissions are projected to decline as we approach 2040. global energy consumption is defined as the total energy used by an individual or organizations from around the world. use the graph above to analyze the projected energy consumption from now until 2040. which statements in the prompt apply? a) a, b, d b) b, c, d c) a, c, d d) a, b, c, d
Answers: 1
Physics, 22.06.2019 17:30, moneyyfletcher
Atruck driver is attempting to deliver some furniture. first, he travels 8 km east, and then he turns around and travels 3 km west. finally, he turns again and travels 13 km to his destination. what is the drivers total displacement?
Answers: 1
Physics, 23.06.2019 00:00, supermkimbrel
A15,000 kg rocket traveling at +230 m/s turns on its engines. over a 6.0 s period it burns 1,000 kg of fuel. an observer on the ground measures the velocity of the expelled gases to be −1,200 m/s.
Answers: 3
Do you know the correct answer?
Questions in other subjects:

Mathematics, 07.05.2020 02:15
Mathematics, 07.05.2020 02:15
Mathematics, 07.05.2020 02:15

Mathematics, 07.05.2020 02:15


