

Physics, 06.04.2020 23:35, leandrogarin37p2g5ds
A cart of mass M is attached to an ideal spring that can stretch and compress equally well. The cart and spring rest on a smooth horizontal track. The cart is pulled to position A and released. The cart then moves toward position E, where it reverses direction and returns again to position A.
a) show with the sketch of a position diagram how the velocity of the cart changes between the points indicated
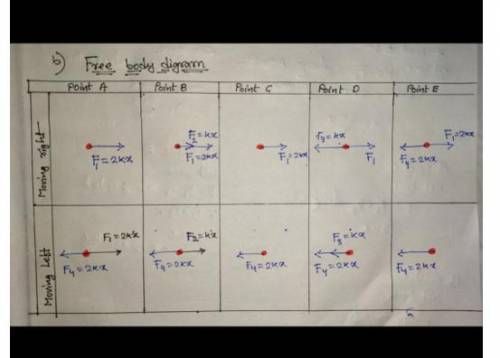
b) The dots below represent the cart at different labeled positions. Draw free body diagrams showing and labeling all the forces exerted on the cart at each labeled position. Draw the relative lengths of all vectors to reflect the relative magnitude of all forces. You will create one set of sketches for when the cart is moving to the right and a second set for when the car is moving to the left.
c) do the diagrams above indicate whether the cart is moving left or right? Justify your claim with evidence.
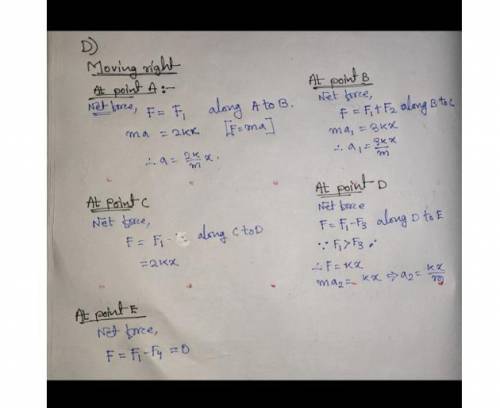
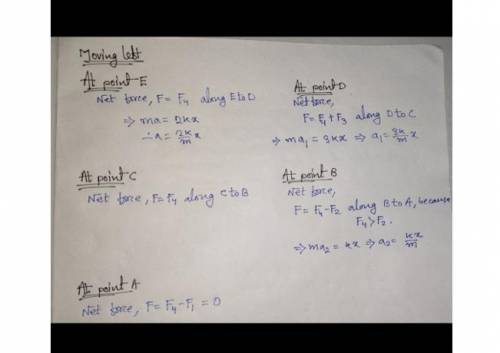
d) at each position, compare the direction of the net force exerted by the spring on the cart and the carts displacement from equilibrium when at that position. Note that this question is not asking whether the cart is moving right or left. Use these results to briefly explain why your claim in part C makes sense.

Answers: 1


Other questions on the subject: Physics
Physics, 22.06.2019 23:10, lyssssasantiago9844
Estimate of the number of stars in our galaxy
Answers: 1
Physics, 23.06.2019 02:10, Nathaliasmiles
Find the steady-state temperature at the center of the plate = /2, = /2) for sums of w from n=1 to n=19 (only odd values). find the value of n for which the change in /2, /2) is less than 1% from the value at the previous n. at this point, we consider the solution converged. does the value of the temperature at the center seem reasonable? in this part, the values of x and y are constant scalar values. you should produce a plot of the value of n on the horizontal and the estimate of the temperature at the center of the plate on the vertical. b. using the value of n (or larger) that resulted in convergence in part (a), create a contourf plot of the temperature distribution across the entire plate. use enough spatial subdivisions to create a useful plot. comment on the results. hint: you need to determine what “x” and “y” values to use to make your t matrix. i recommend using a different number of x and y values. use enough x and y values so that the plot is “smooth”.
Answers: 1
Do you know the correct answer?
A cart of mass M is attached to an ideal spring that can stretch and compress equally well. The cart...
Questions in other subjects:

Mathematics, 15.07.2019 19:10

Social Studies, 15.07.2019 19:10
Mathematics, 15.07.2019 19:10


History, 15.07.2019 19:20
Mathematics, 15.07.2019 19:20
Mathematics, 15.07.2019 19:20


