When you read this question, the first thing you need to do is
sit back, close your eyes, and say to yourself: "Self ! We got
us a question here about 'half-life'. We can't do a thing with it
until we figure out what 'half-life' means. Now get to work !"
After that, you're not allowed to move or open your eyes until you
know what 'half-life' means . . . except to open a book or web-search
for 'half-life'.
Eventually, you'll either remember or discover that the 'half-life'
of a radioactive sample is the time it takes for half of its atoms
to fall apart and disappear while the other half survive.
However many atoms of it you have ... at any time ... half of those
will be gone after one half-life later.
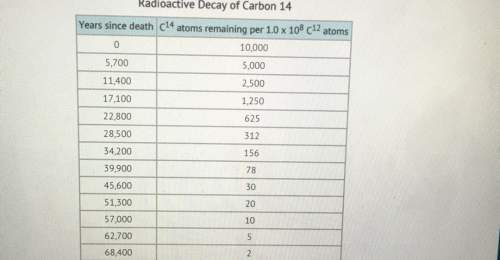
Now look at the chart:
This chart is really made for dummies.
-- Pick ANY line of the top 7 lines.
Make it the top line on the chart if you want, I don't care.
See how many C¹⁴ atoms there are in the second column.
-- Now look down ... not too far.
Find the line where half of those C¹⁴ atoms are gone.
-- "It's the very next line " you say ?
That's good. That's very good.
-- Now look in the first column and see how many years passed
while half of those atoms were disappearing.
It's 5,700 years to the next line.
THAT's the HALF-LIFE of C¹⁴ !
As soon as you knew what half-life means, you could have
opened the chart and looked at the first two lines.
From line-1 to line-2, half of the C¹⁴ atoms are gone, and
5,700 years pass, so the half-life is 5,700 years. Done !
Now I'll tell you: There's a mistake on this chart.
On the 9th line, at 45,600 years, the number of atoms
should be 39 , not 30.
Make that change, and the whole chart works, top to bottom.
The first column is all in equal steps of 5,700 years, and the
second column is all in equal steps that round to 50% .

![[\ T_{1/2}\ ]](/tpl/images/0298/6199/cea5b.png) of a radio active substance is defined as the time in which half of the radio active specimen has undergone decay.
of a radio active substance is defined as the time in which half of the radio active specimen has undergone decay. .
.


