

Mathematics, 22.07.2019 00:32, foxesforlife45
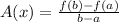
The graph shows the function f(x). which value is closest to the average rate of change from x = 1 to x = 4? a.−3.5 b.−2.3 c. −1.4 d .−0.3

Answers: 1
 ....[1]


Similar questions
Mathematics, 27.08.2019 03:00, lpslover26237
Answers: 2
Do you know the correct answer?
The graph shows the function f(x). which value is closest to the average rate of change from x = 1...
Questions in other subjects:


Computers and Technology, 01.08.2019 12:00

Arts, 01.08.2019 12:00


