

Mathematics, 22.07.2019 16:30, areynaguzman100
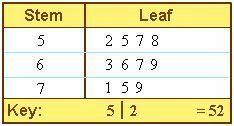
This stem-and-leaf plot represents the students' test scores in history. what is the median for the data in this stem-and-leaf plot? a. 52 b. 58 c. 66 d. 71

Answers: 2


Other questions on the subject: Mathematics
Mathematics, 21.06.2019 13:30, 22justinmcminn
Which equation represents a proportional relationship that has a constant of proportionality equal to 1/5
Answers: 1
Mathematics, 21.06.2019 19:30, kklove6700
What is the result of adding the system of equations? 2x+y=4 3x-y=6
Answers: 2
Mathematics, 22.06.2019 00:50, genyjoannerubiera
Atravel agent is booking a trip to england, scotland, ireland, and france for a group of senior citizens. the agent sent surveys to the group, asking which countries they would like to visit, in order, and created the shown preference schedule (e = england, i = ireland, s = scotland, f = france). which country is the condorcet winner? number of votes 15 12 16 19 1st f e e i 2nd e s i s 3rd s i s e 4th i f f f 1. scotland 2. england 3. france 4.ireland
Answers: 1
Do you know the correct answer?
This stem-and-leaf plot represents the students' test scores in history. what is the median for the...
Questions in other subjects:

Chemistry, 09.04.2020 01:43


Mathematics, 09.04.2020 01:43

History, 09.04.2020 01:43
Chemistry, 09.04.2020 01:43


