

Mathematics, 18.11.2019 02:31, krystalhurst97
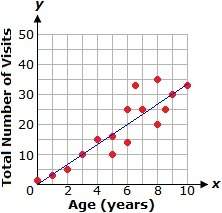
The graph below shows a scatter plot and the line of best fit relating the ages of children and the total number of times they have visited the doctor.
use the line of best fit to estimate the age of a child who has visited the doctor 40 times.
13 years old
11 years old
14 years old
12 years old

Answers: 3


Other questions on the subject: Mathematics
Mathematics, 21.06.2019 13:30, Angeldelissa
Which expression is factored form? x^2+14x+48 a) (x-8)(x-6) b) (x+6)(x-8) c) (x+8)(x-6) d) (x+6)(x+8)
Answers: 1
Mathematics, 21.06.2019 15:10, sickomode2048
Choosing a booth location: your manager is sending two people to work at the conference. she wants a booth that will give your company good visibility for no more than 35% of the total budget ($3000). the conference coordinator just told you there are only five booths left. which booth will you choose? write the inequality that shows how much money you can spend on the booth simplify the inequality that shows how much money you can spend on the booth.
Answers: 2
Do you know the correct answer?
The graph below shows a scatter plot and the line of best fit relating the ages of children and the...
Questions in other subjects:

Mathematics, 16.06.2021 19:10

Spanish, 16.06.2021 19:10


History, 16.06.2021 19:10

Medicine, 16.06.2021 19:20


