

Mathematics, 06.10.2019 10:02, juelchasse
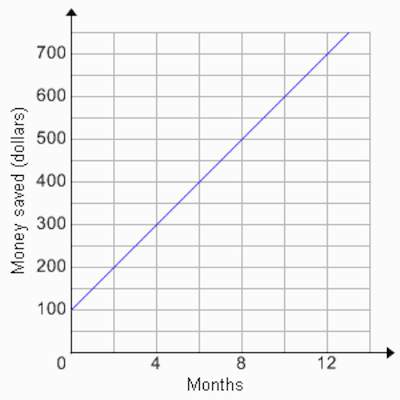
Alex is trying to start a savings plan. the following graph represents his projected savings over the next 12 months. how much money will he have saved by the sixteenth month?
graph with months on the x axis and money saved in dollars on the y axis. graph shows a line hitting points (0, 100), (4, 300), (8, 500), and (12, 700)
$700
$800
$900
$1000

Answers: 1


Other questions on the subject: Mathematics
Mathematics, 21.06.2019 19:00, fatherbamboo
What is the best way to answer questions with a x expression in the question. for example 3x + 10x=?
Answers: 1
Do you know the correct answer?
Alex is trying to start a savings plan. the following graph represents his projected savings over th...
Questions in other subjects:

History, 17.10.2019 21:40
Mathematics, 17.10.2019 21:40

Computers and Technology, 17.10.2019 21:40

Chemistry, 17.10.2019 21:40


Health, 17.10.2019 21:40
Mathematics, 17.10.2019 21:40


